

Solana (SOL) Price: Head-and-Shoulders Pattern Points to $50 Target
TLDR
- Solana (SOL) has dropped 38% in the last 30 days and fell to a two-year low of $67 on Friday.
- Multiple analysts identify a head-and-shoulders pattern on several time frames pointing to a price target of $50 or lower.
- SOL has lost over 72% of its value since hitting a cycle top of about $295 in January 2025.
- Solana ETFs recorded nearly $11.9 million in net outflows, the second-largest outflow day on record.
- The weekly Gaussian Channel has flipped bearish, and price must reclaim $105-$110 resistance to invalidate the current downtrend.
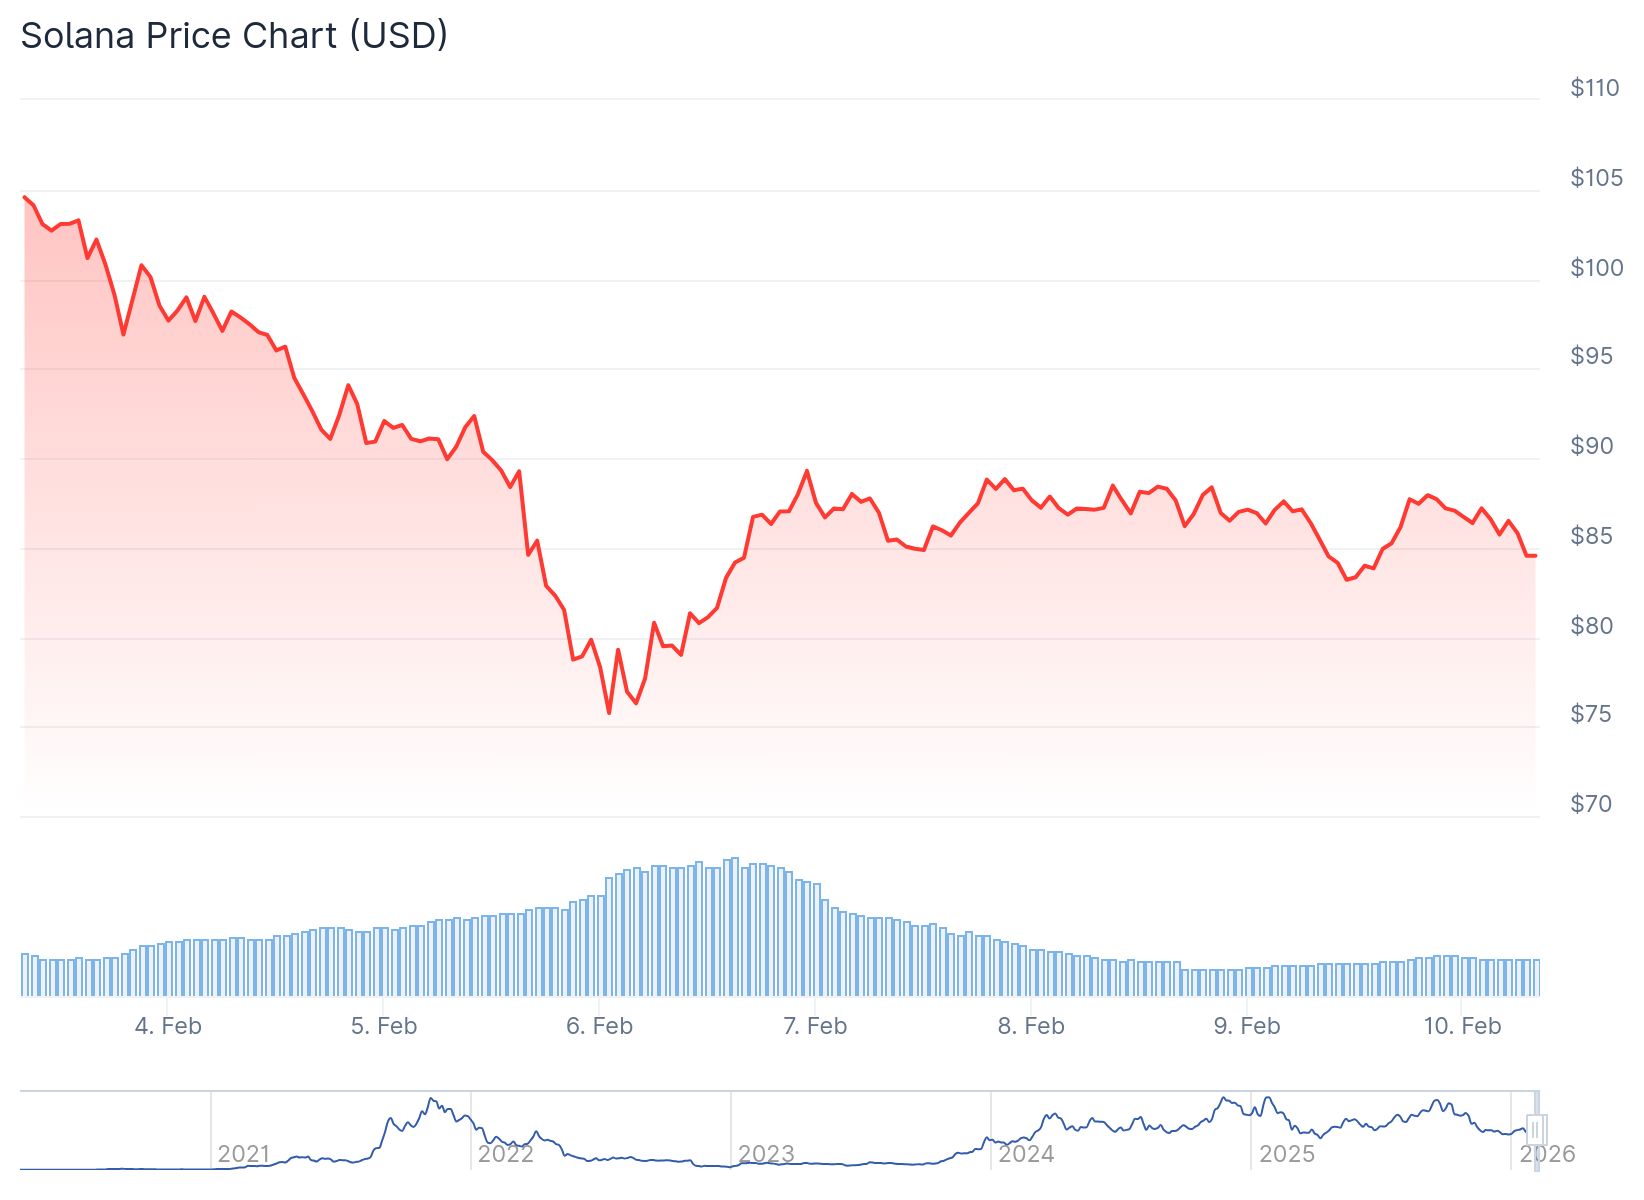
Solana has fallen 38% over the last 30 days. The cryptocurrency hit a two-year low of $67 on Friday.
 Solana (SOL) Price
The decline has pushed SOL into the seventh position among cryptocurrencies by market cap. Analysts say the downside may not be finished yet.
SOL has lost over 72% of its value since January 2025. The cryptocurrency reached a cycle top of about $295 during that month.
Multiple analysts have identified a head-and-shoulders pattern across different time frames. This technical formation typically signals further price declines.
Crypto analyst Bitcoinsensus posted a chart on Monday showing the pattern confirmation. The analyst stated that the target could be as low as $50 per SOL.
Another analyst, Nextiscrypto, called it a classic head-and-shoulders pattern. The measured move points to $45 according to their analysis.
Pseudonymous analyst Shitpoastin identified a larger pattern on the monthly chart. This formation spans two years and suggests a potential drop to $30.
The two-day chart shows SOL broke below the neckline at $120 on January 30. The measured target from this breakdown sits at $57, representing a 32% drop from current levels.
Support Levels and Historical Patterns
The Market Value to Realized Value bands offer some context for potential support. Last week’s crash found support at the lowest MVRV band boundary at $75.
These bands track when SOL trades below or above the average price where traders last moved their coins. Historically, SOL prices have dropped near or below the lowest MRVR band before finding a bottom.
In March 2022, SOL bounced from around $75. The price then rose 87% within three weeks to reach $140. A similar rebound happened in December 2020.
The FTX crash in November 2022 created a different scenario. SOL dropped another 70% below the band and bottomed around $7 in December that year.
Institutional Interest Cooling
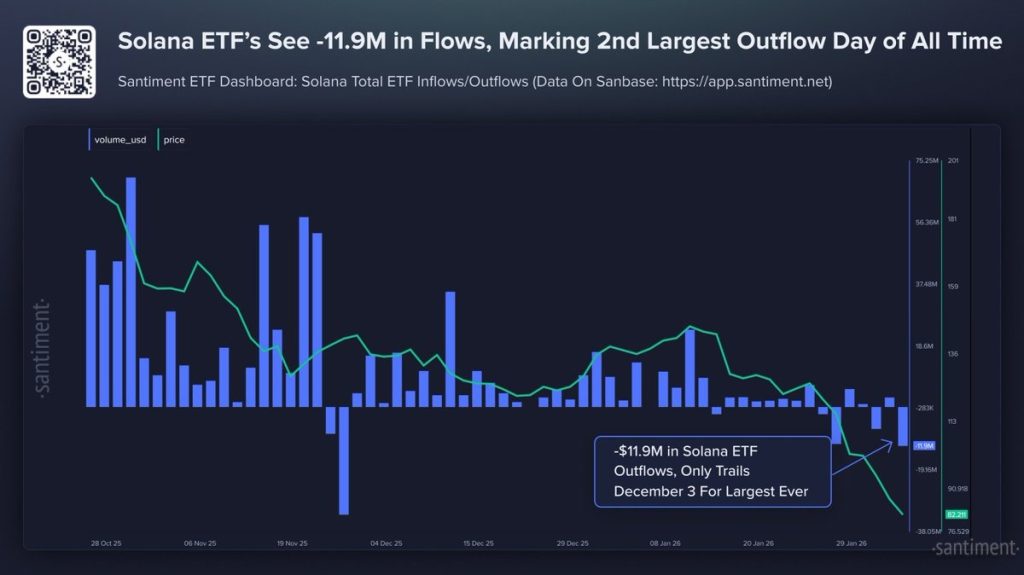
Solana ETFs have seen a shift in flows recently. The funds recorded nearly $11.9 million in net outflows, marking the second-largest outflow day on record.
 Source; Santiment
This outflow trails only December 2025 numbers. The timing coincides with SOL losing over 62% of its market cap in four months.
Historically, sharp ETF outflows during extended downtrends have aligned with late-stage selling. These moves have sometimes preceded stabilization periods once selling pressure exhausts itself.
Technical Indicators Show Weakness
Selling pressure returned on the weekly chart after a brief rebound attempt. Buyers failed to deliver sustained follow-through.
Last week saw a sharp spike in trading volume that triggered volatility. Volume has since cooled and price remains stuck in a tight range.
The weekly Gaussian Channel has flipped bearish. This shift suggests SOL may have entered a broader downtrend rather than a short correction.
The weekly RSI appears to have bottomed and is attempting a rebound. This suggests selling pressure may be slowing down.
Price remains below the $105-$110 resistance zone. Failure to reclaim this range could keep downside pressure intact.
A move toward $77-$75 is possible if current levels don’t hold. A deeper breakdown would bring the $50-$55 region into focus.
Bulls need a strong weekly close above $115 to invalidate the bearish setup. That would shift momentum toward $135-$150.
Until then, the current technical setup favors caution. The risk remains skewed to the downside as February progresses.
SOL currently trades around $84.51 after the recent bounce from $67.
The post Solana (SOL) Price: Head-and-Shoulders Pattern Points to $50 Target appeared first on CoinCentral.


You May Also Like

Y Combinator rolls out new deal package for crypto startups

China solar panel exports to Africa jump by 83% as demand for clean energy surges

Amazon (AMZN) Stock; Rises on $33B Southeast Asia AI and cloud push


