

Altseason 2026 Might Be the Biggest One Yet – Here’s What This Chart Is Showing
Crypto traders are starting to talk about altseason again, and one chart is a big reason why. A post from Crypto Patel has been spreading fast, pointing to a long-term pattern in the ALTS/BTC dominance chart that has shown up in every major cycle so far.
The main idea is that altcoins tend to stay quiet for long stretches, but once the rotation begins, the move can be explosive.
The chart highlights the same structure playing out again as the market heads deeper into 2026. It doesn’t guarantee anything, but it explains why so many traders are watching this setup closely, especially after what happened in 2018 and 2021.
Read Also: 1% of All Hedera (HBAR) Vanished Silently: Bitcoin Did This Right Before Its Rally
The Altcoin Chart That Traders Keep Watching
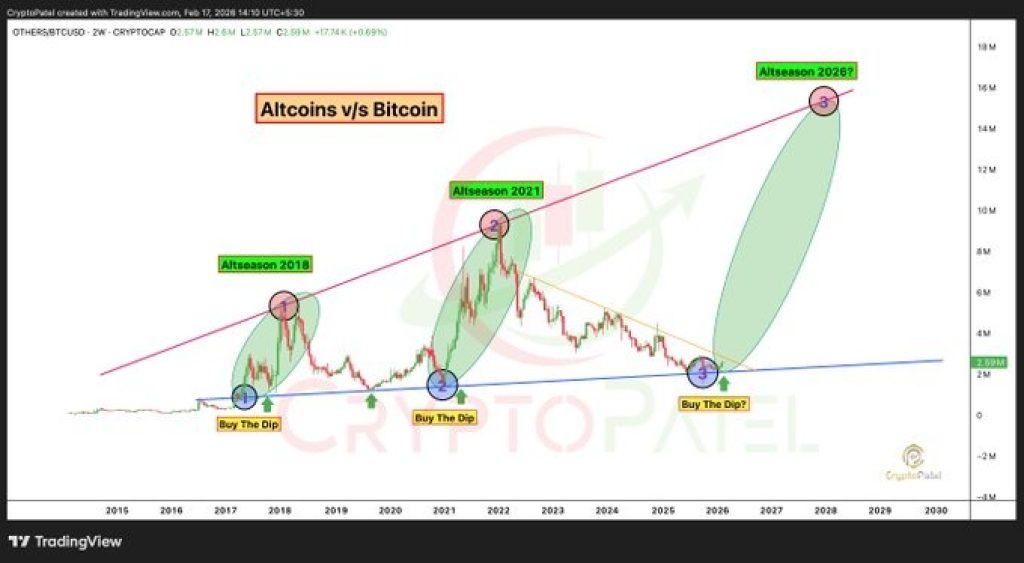
The ALTS/BTC chart plots the performance of altcoins relative to Bitcoin over time. Notice that altcoin dominance has been following a rising channel for several years, and each time it has touched the bottom of the channel, it has led to a massive breakout period in the future.
In 2018, the altcoins went on a tear as Bitcoin’s momentum died down, and this is the first peak that is evident on the chart. This has happened again in 2021, when the altcoins went on a massive tear as the Bitcoin dominance stopped rising.
Notice that the ALT chart shows the price to be at the bottom of the channel once again, which is why some traders think that the market is about to follow the same pattern into 2026.
 Source; X/CryptoPatel
Why Altcoins Tend to Run After Bitcoin
Altseason usually comes after Bitcoin has already done the heavy lifting. The Bitcoin price tends to move first because it is the most liquid and most trusted asset in the market, so money moves there first in a cycle. When Bitcoin slows down or starts to trade sideways, traders start looking for bigger gains elsewhere.
This is where altcoins come in. Altcoins are smaller and more volatile, and they tend to move faster once liquidity flows into them.
This is the cycle Patel is pointing to, where Bitcoin leads first, and then the rest of the market follows with sharper percentage moves once the rotation begins.
Read Also: Silver Price to $1,000? These Two Historic Ratios Say It’s Not as Crazy as It Sounds
What Makes 2026 Interesting
The reason 2026 is getting attention is because the chart shows the market approaching the same breakout zone that triggered altcoin runs in previous cycles.
Patel argues that if the channel continues to hold, then the next major upside phase could arrive as capital shifts away from Bitcoin again.
That doesn’t mean a supercycle is guaranteed, but it does show why traders are starting to position early. The structure has already repeated twice, and crypto markets have a history of moving in these rhythm-like waves where dominance shifts back and forth between Bitcoin and altcoins.
Read Also: Why Is Kaspa Trending Everywhere Despite KAS Price Being Stuck Below $0.04?
The Key Thing to Remember
Altcoin seasons rarely begin with excitement. They usually start after months of boredom, heavy pullbacks, and widespread doubt, which is exactly why early accumulation phases feel uncomfortable. By the time retail traders notice what is happening, much of the move is often already underway.
That is the core of Patel’s message. The market may still be in the quiet part of the cycle, but if the rotation pattern repeats, the next altcoin run could happen faster than most expect once momentum returns.
Altseason 2026 is still a forecast, but the ALTS/BTC chart is displaying a pattern that traders have seen before. This happened in 2018 and 2021, where the same pattern occurred where Bitcoin led first, and then altcoins took over once dominance started to move.
If that rotation starts again, altcoins could be next in line for a major breakout phase. For now, the chart is enough to get the market talking again, because the structure looks very similar to the early stages of past altcoin cycles.
Subscribe to our YouTube channel for daily crypto updates, market insights, and expert analysis.
The post Altseason 2026 Might Be the Biggest One Yet – Here’s What This Chart Is Showing appeared first on CaptainAltcoin.


You May Also Like

Yiwu Agent: Smarter Sourcing in China

ChatGOT Review 2026: Free AI Chatbot (No Sign-up)

Bitcoin Underperforms Stocks: Why BTC Is Missing the AI-Led Risk Rally


