

Ethereum (ETH) Price: Support and Resistance Levels Traders Are Watching Right Now
TLDR
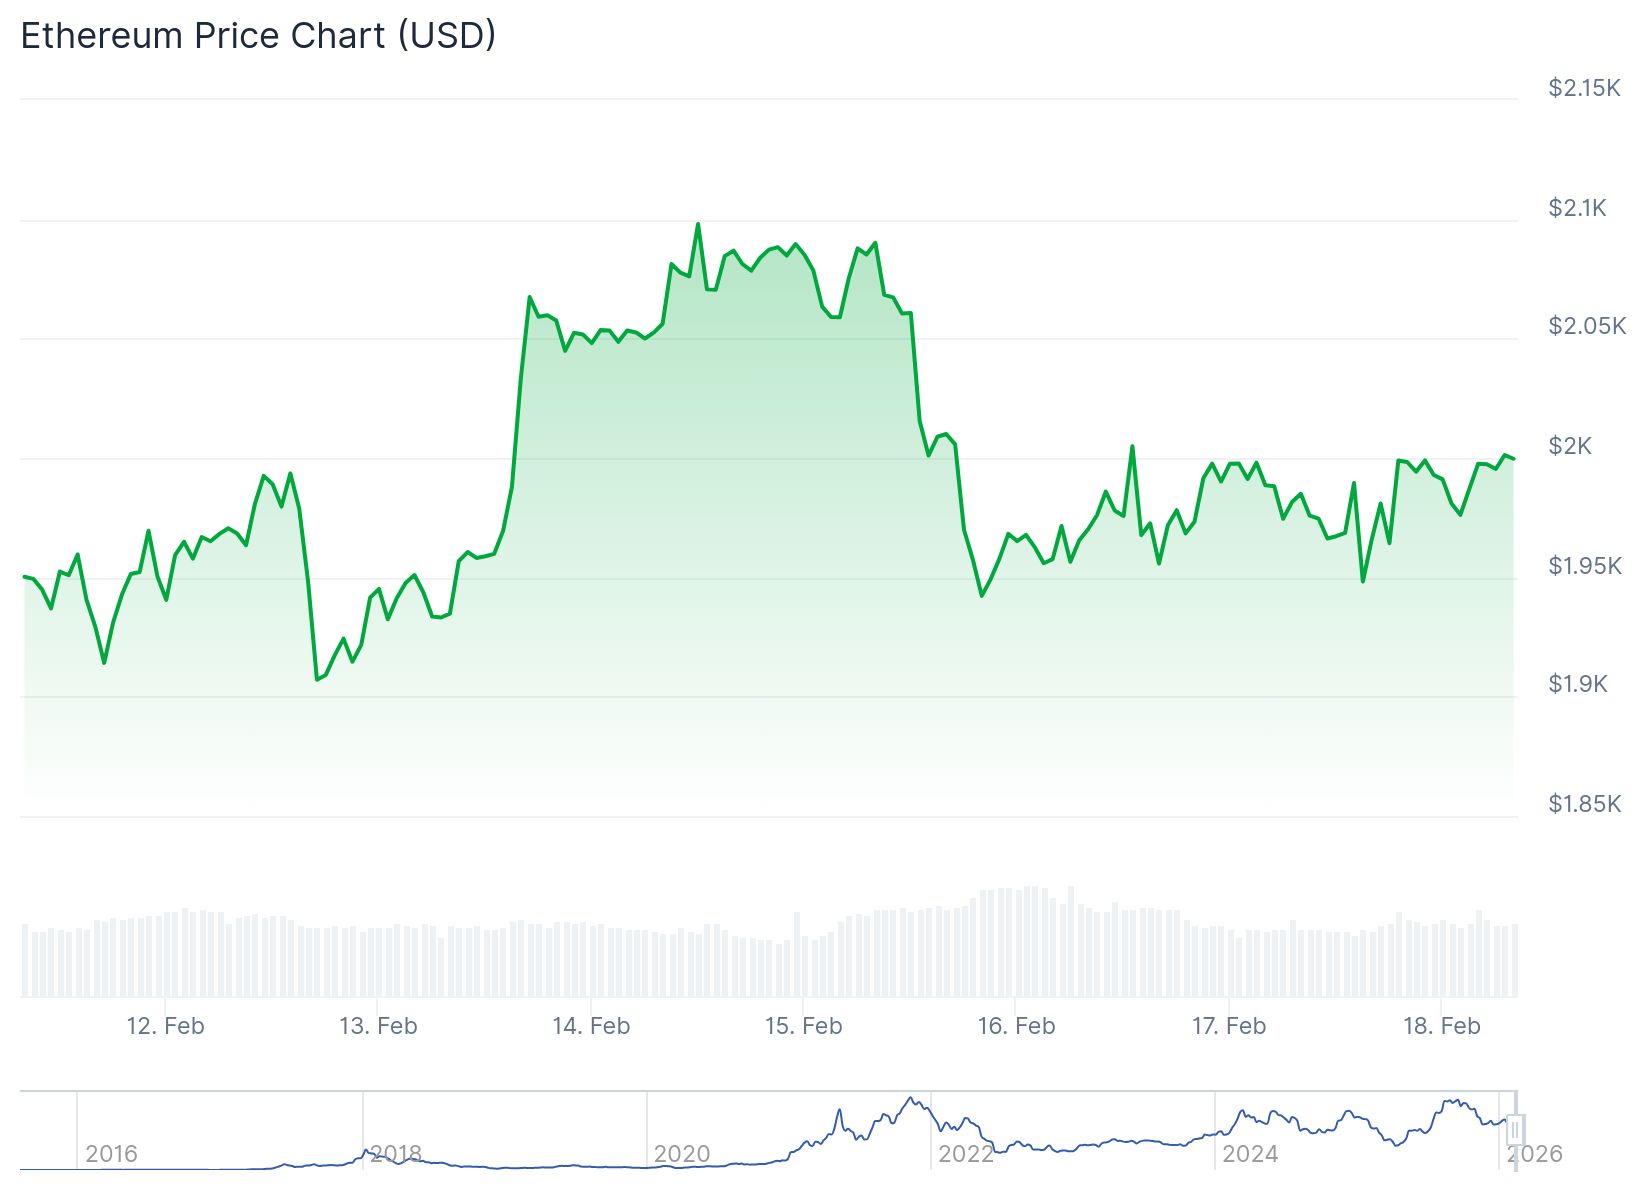
- ETH is trading between $1,950–$2,000, below all major EMAs, with sellers still in control
- Key resistance sits at $2,020–$2,030; breaking this is needed for any short-term recovery
- A $600M spot inflow spike in February hints at fresh accumulation interest
- Open interest has dropped to the mid-$20B range, reflecting lower leverage and caution
- Analysts are split: price could bounce to $2,650 if $1,800 holds, or fall to $1,300 if it breaks
Ethereum is hovering near the $1,950–$2,000 range after a steep drop from its recent high of around $3,400. The recovery has been slow, and the overall market structure still favors the sellers.
 Ethereum (ETH) Price
ETH is currently trading below its 20, 50, 100, and 200 exponential moving averages (EMAs). That’s a clear sign that the downtrend is still in place.
The drop began after ETH broke below $2,600, which picked up speed on the way down. Price found a floor near $1,746, which lined up with a key Fibonacci support level, before staging a bounce.
A recent low of $1,928 was set, and ETH has since climbed back above $1,965. There is now a bullish trend line forming on the hourly chart with support around $1,955.
Key Resistance Levels to Watch
The $2,020–$2,030 zone is the first major hurdle. This area is where the 20 and 50 EMAs are clustered, making it a wall that bulls need to break through.
Above that, $2,137 is the next Fibonacci retracement level. A clean move past this point could open the door to $2,380, which analysts describe as the key ceiling for any medium-term recovery.
If ETH clears $2,380, the next targets would be $2,576 and $2,772. However, those levels are far off while price stays under the EMA cluster.
On the downside, $1,913 aligns with the lower Bollinger Band and is acting as dynamic support. If that breaks, $1,746 comes back into play.
Spot Inflows and Derivatives Data
Open interest in ETH derivatives has cooled from over $60 billion during previous rallies to around the mid-$20 billion range. This shows traders are using less leverage than before.
Spot flow data told a negative story for most of late 2025, with net outflows running for months. February changed that, with a single inflow spike of over $600 million recorded.
Analyst Price Targets
Analyst Crypto Patel says ETH needs to hold the $1,800 level. If it does, a move to $2,650 is possible. If $1,800 breaks, his target drops to $1,300.
Analyst Javon Marks points to a hidden bull divergence pattern on the chart. He says a full recovery could take ETH back to the $4,900 area, which would be above its all-time high.
ETH is currently trading below $2,000 and the 100-hourly simple moving average, with $2,015–$2,035 as the next immediate resistance zone.
The post Ethereum (ETH) Price: Support and Resistance Levels Traders Are Watching Right Now appeared first on CoinCentral.


You May Also Like

Circle Mints 250 Million USDC on Solana as Stablecoin Demand Surges

High Blood Pressure Disproportionately Affects Asian American, Native Hawaiian, and Pacific Islander Communities, American Heart Association Warns

BTC Volatility Approaches Crucial Resistance as ETFs and Inflation Indicators Set Tone for Sentiment


