

Oil Prices Face Critical Test Amid High-Stakes US-Iran Talks and Geopolitical Tensions – Rabobank Analysis
BitcoinWorld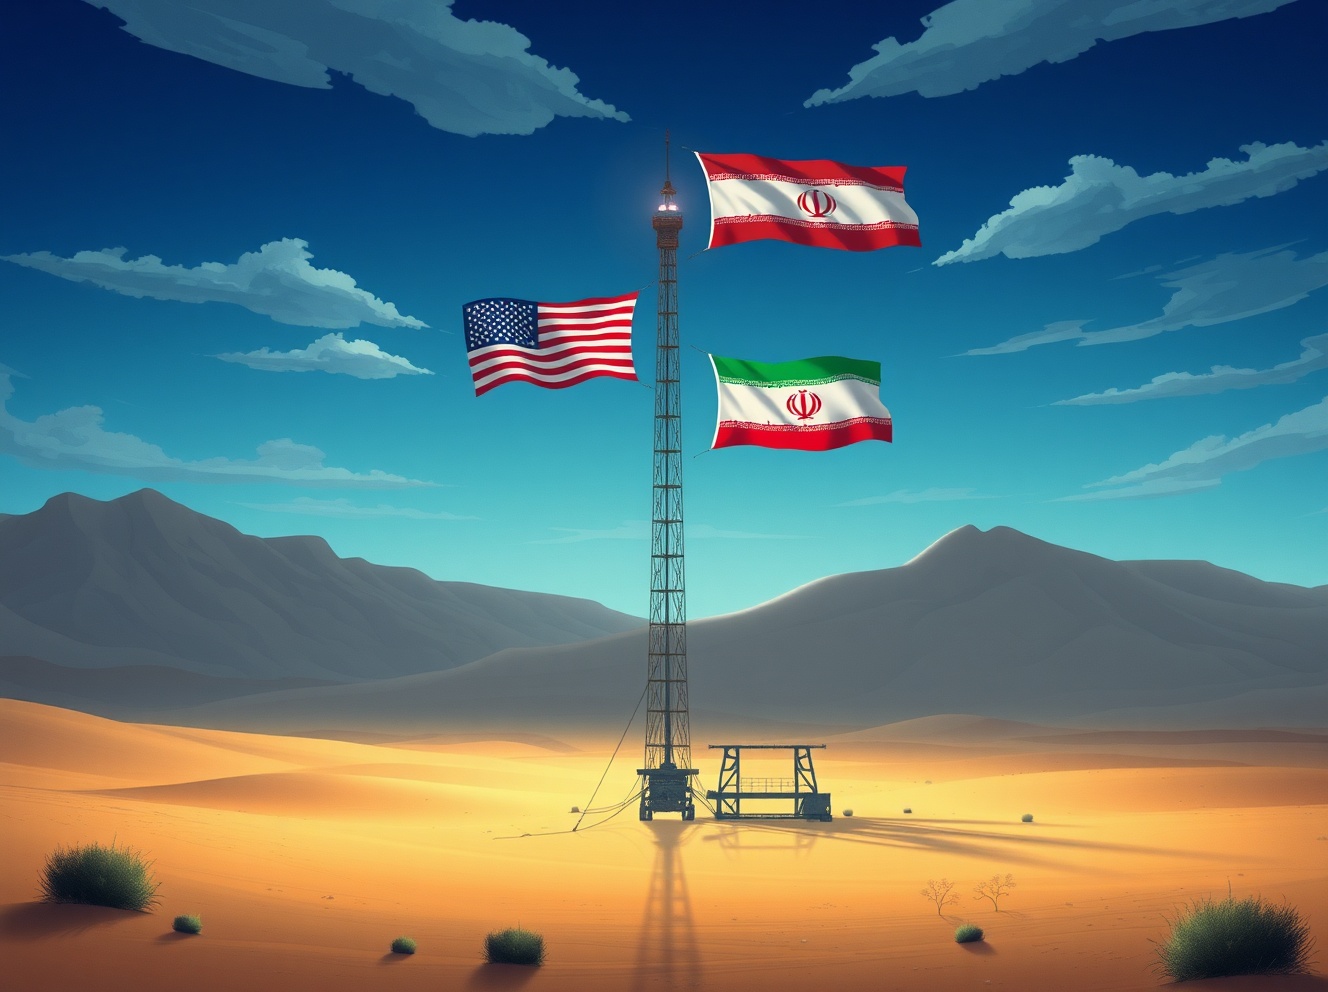
Oil Prices Face Critical Test Amid High-Stakes US-Iran Talks and Geopolitical Tensions – Rabobank Analysis
Global oil markets entered a period of heightened volatility this week as diplomatic negotiations between the United States and Iran intensified against a backdrop of persistent geopolitical tensions. According to analysis from Rabobank’s commodities research team, these developments create a complex landscape for crude oil prices in 2025, with technical charts revealing critical support and resistance levels that traders monitor closely. The potential for significant market movement exists as diplomatic outcomes could either ease supply constraints or exacerbate existing pressures.
Oil Price Dynamics and Geopolitical Crosscurrents
Crude oil prices demonstrate particular sensitivity to Middle Eastern geopolitics, especially concerning Iran’s production capacity and export capabilities. Historically, diplomatic progress between Washington and Tehran correlates with downward pressure on global benchmarks like Brent and WTI. Conversely, escalating tensions typically produce immediate price spikes. Rabobank’s latest research indicates that current price charts reflect this uncertainty through increased volatility and narrowing trading ranges. Market participants currently weigh potential supply increases against ongoing regional instability.
Technical analysis from Rabobank reveals several key chart levels that warrant attention. The $75-80 per barrel range for Brent crude represents a crucial support zone, while resistance appears firm near $90. These levels correspond with fundamental factors including OPEC+ production decisions, global inventory data, and demand forecasts from the International Energy Agency. Furthermore, trading volumes have increased significantly during recent diplomatic announcements, suggesting heightened market sensitivity to negotiation developments.
Historical Context of US-Iran Energy Relations
The relationship between the United States and Iran has shaped global oil markets for decades. Following the 2015 Joint Comprehensive Plan of Action (JCPOA), Iranian oil exports increased substantially, adding approximately 1 million barrels per day to global supply. However, the 2018 US withdrawal from the agreement and subsequent sanctions removed this volume from markets, contributing to supply tightness. Current negotiations aim to address nuclear concerns while potentially allowing renewed Iranian exports.
Rabobank analysts note that any agreement would likely include a phased approach to sanction relief. This structure would prevent immediate market flooding but could gradually add 500,000 to 1 million barrels daily within 6-12 months. Such incremental increases would coincide with OPEC+ production adjustments, creating a managed supply landscape. Historical price patterns suggest markets typically price in diplomatic outcomes weeks before official announcements, making current chart patterns particularly informative.
Regional Geopolitics and Supply Chain Vulnerabilities
Beyond direct Iranian exports, Middle Eastern stability affects oil transportation through critical chokepoints. The Strait of Hormuz handles approximately 20% of global petroleum consumption, while Red Sea shipping routes face periodic disruptions. Rabobank’s geopolitical risk assessment incorporates these transit vulnerabilities, noting that diplomatic progress often reduces regional tensions and shipping insurance premiums. Conversely, negotiation breakdowns increase the probability of supply disruptions.
Recent incidents in maritime routes have already influenced oil price charts through risk premium fluctuations. This premium, estimated at $3-8 per barrel during tense periods, reflects insurance costs and alternative routing expenses. Technical charts currently show decreasing risk premiums as diplomatic engagement continues, though this trend remains fragile. Market structure indicators like backwardation and contango also reflect these geopolitical assessments through forward price curves.
Global Economic Impacts and Demand Considerations
Oil price movements significantly influence global inflation and economic growth trajectories. Central banks worldwide monitor energy costs carefully when formulating monetary policy. Rabobank’s macroeconomic team notes that sustained high prices could delay interest rate cuts in major economies, while price declines might accelerate monetary easing. This feedback loop between oil markets and economic policy adds complexity to price forecasting.
Demand-side factors present additional considerations. The International Energy Agency’s latest report projects modest global demand growth of 1.1 million barrels per day in 2025, primarily driven by non-OECD nations. However, economic slowdowns in major economies could reduce this estimate. Rabobank’s analysis suggests that demand elasticity has increased due to energy transition efforts, making consumption more responsive to price changes than in previous decades.
Key factors influencing current oil market dynamics include:
- Diplomatic progress in US-Iran negotiations
- OPEC+ production policy decisions
- Global inventory levels and storage capacity
- Economic growth projections from major institutions
- Shipping route security and transportation costs
Rabobank’s Analytical Framework and Chart Methodology
Rabobank employs a multi-factor approach to oil market analysis, combining technical chart patterns with fundamental supply-demand assessments. Their commodities team examines price action across multiple timeframes, identifying support and resistance levels that correspond with geopolitical events. Volume analysis and open interest data provide additional context about market participation and conviction.
The bank’s research emphasizes correlation analysis between diplomatic developments and price movements. Historical patterns reveal that oil prices typically experience increased volatility during negotiation periods, with directional trends establishing only after concrete outcomes emerge. Current chart patterns suggest markets price in a 60-70% probability of successful negotiations, though this implied probability fluctuates daily based on diplomatic rhetoric.
| Factor | Price Impact | Duration |
|---|---|---|
| Diplomatic Optimism | -2% to -5% | 1-3 trading days |
| Negotiation Setbacks | +3% to +8% | 2-5 trading days |
| OPEC+ Production Cuts | +4% to +10% | 1-4 weeks |
| Inventory Drawdowns | +1% to +3% | Intraday to 2 days |
Market Participants and Positioning Analysis
Commitments of Traders reports reveal how different market participants position themselves amid geopolitical uncertainty. Commercial hedgers, including producers and consumers, typically increase activity during volatile periods. Meanwhile, money managers and speculative accounts often amplify price movements through momentum trading. Rabobank’s analysis of positioning data suggests that current net-long positions remain below historical averages, indicating cautious market sentiment.
This cautious positioning creates potential for significant price moves if unexpected developments occur. Low speculative participation means fewer positions need unwinding during news events, potentially allowing cleaner trend establishment. However, it also suggests limited conviction about directional outcomes, with many participants awaiting clearer diplomatic signals before establishing substantial positions.
Conclusion
Oil prices face a critical juncture as US-Iran negotiations progress alongside persistent geopolitical tensions. Rabobank’s analysis of price charts and market fundamentals reveals a complex landscape where diplomatic outcomes could significantly influence global supply balances. Technical levels between $75 and $90 per barrel for Brent crude represent key thresholds that may determine medium-term price direction. Market participants should monitor diplomatic developments closely while considering broader economic impacts and demand dynamics. The interplay between geopolitical events and market fundamentals will likely continue driving volatility, making comprehensive analysis essential for informed decision-making in oil markets.
FAQs
Q1: How do US-Iran negotiations typically affect oil prices?
Historically, diplomatic progress between the US and Iran places downward pressure on oil prices by increasing potential supply, while negotiation breakdowns or tensions create upward pressure through risk premiums and supply concerns.
Q2: What timeframe do oil markets typically price in for diplomatic outcomes?
Markets often begin pricing potential outcomes weeks before official announcements, with price adjustments occurring gradually as probability assessments change based on diplomatic signals and expert analysis.
Q3: How does Rabobank incorporate geopolitical analysis into oil price forecasts?
Rabobank employs a multi-factor approach combining technical chart analysis with fundamental supply-demand assessments, geopolitical risk evaluation, and correlation studies between diplomatic events and historical price movements.
Q4: What are the key chart levels to watch in current oil markets?
Critical technical levels include $75-80 support and $90 resistance for Brent crude, with volume analysis and volatility indicators providing additional context about market sentiment and potential breakout directions.
Q5: How do Middle Eastern shipping routes affect global oil prices?
Critical chokepoints like the Strait of Hormuz influence prices through risk premiums that reflect insurance costs and potential disruption risks, with tensions typically adding $3-8 per barrel to prices during unstable periods.
This post Oil Prices Face Critical Test Amid High-Stakes US-Iran Talks and Geopolitical Tensions – Rabobank Analysis first appeared on BitcoinWorld.


You May Also Like

LIST: Bayanihan initiatives amid soaring oil prices

Crypto Hack: Drift Protocol Drained Over $200M in Private Key Breach

The Chemistry of UV Resistance: How Titanium Dioxide Protects Against the California Sun


