

SUI Price Analysis: Can ETF Launch Push SUI Back Above $1?

This article was first published on The Bit Journal.
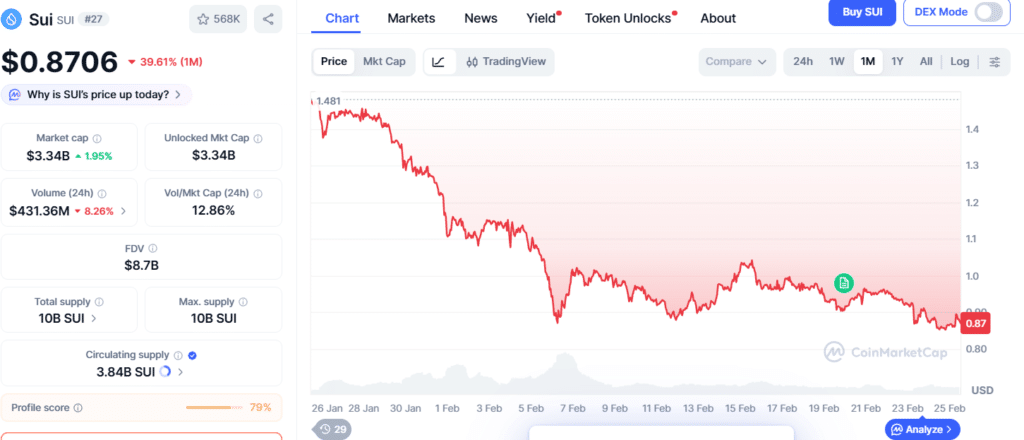
SUI price analysis is indicating early signs that the token may be finding support after a long period of decline. Currently trading around $0.8705, SUI still struggles to break above the important $1 level.
The recent introduction of the 21Shares Spot SUI ETF on Nasdaq adds a new factor, giving U.S. investors regulated access to SUI through traditional brokerage accounts. Experts note that the combination of technical support levels, potential institutional inflows, and investor interest in the ETF could influence whether SUI’s short-term rebound holds or faces further downward pressure.
What does SUI price analysis reveal about the asset’s recent slide?
SUI price analysis shows the token currently trading around $0.8705, reflecting a 2.03% gain over the last 24 hours. Despite this modest short-term increase, the broader outlook remains under pressure as the asset continues to struggle to reclaim the important $1 psychological threshold.
 SUI Price Analysis: Can ETF Launch Push SUI Back Above $1? 3
Over the past seven days, SUI has fluctuated between $0.8519 and $0.9783, with weekly losses standing at 9.97%, signaling continued weakness in the market. Over the course of the past month, the token has fallen nearly 40%, highlighting that the decline is a result of sustained selling pressure rather than a single short-term event, and indicating that investors remain cautious amid ongoing market volatility.
What do recent trading volumes suggest about market activity?
From a volume perspective, SUI price analysis indicates a slowdown in trading activity. Spot trading volume reached $430.75 million, marking an 8.43% decline compared with the previous day.
Derivatives activity showed a similar trend, with CoinGlass reporting a volume of $688.51 million and open interest slipping to $441.62 million. These figures suggest that traders are reducing leverage rather than building new positions. For market analysts, this often signals caution, as participants step back while the market searches for a clearer direction.
| Metric | Value |
|---|---|
| Spot Volume (24h) | $430.75M (-8.43%) |
| Derivatives Volume | $688.51M |
| Open Interest | $441.62M |
How does the 21Shares Spot SUI ETF impact SUI price analysis?
The launch of the 21Shares Spot SUI ETF on Nasdaq has introduced a new institutional dimension to SUI price analysis. Trading under the TSUI ticker, the ETF began operations on Feb. 24 and provides U.S. investors with direct spot exposure to SUI through standard brokerage accounts. The fund charges a 0.30% management fee, which is waived through October 2026, and started with roughly $9.2 million in assets under management.
21Shares stated that the ETF is structured to track Sui’s price while offering a familiar, regulated option for investors. This spot product follows 21Shares’ previous 2x leveraged SUI ETF launched in December 2025, reflecting the firm’s ongoing expansion into U.S. markets. Analysts note that ETF introductions have historically boosted liquidity in crypto markets, though the actual impact will depend on the size of investor inflows.
What do the technical charts indicate?
From the charts SUI price analysis shows token in a steady downtrend. The price has dropped from above $1.80 to about $0.87. Forming lower highs and lower lows on the daily chart. It remains below the 20-day and 50-day moving averages, which are acting as resistance.
Breaking above 50-day average near $0.94 could be first sign of a shift in short-term momentum. The relative strength index is 33.15. Suggesting neutral conditions while MACD (12, 26) sits at −0.097, pointing to ongoing bearish pressure. The price has been hugging the lower Bollinger Band, with the bands starting to tighten, a setup traders often see before increased volatility.
| Indicator | Value/Status |
|---|---|
| RSI (14) | 33.15 (Neutral/Oversold) |
| MACD (12,26) | -0.097 (Bearish) |
| 50-day MA Resistance | ~$0.94 |
| Key Support | $0.85–$0.87 |
| Bounce Targets | $0.94 / $1.00–$1.20 |
Is the support zone holding strong?
Support between $0.85 and $0.87 has become a key focus in SUI price analysis. If this level holds and buying activity picks up, a short-term bounce toward $0.94 appears possible.
A clear move above $1.00 would add strength to the idea of a broader recovery toward the $1.03 to $1.20 range. On the other hand, if $0.85 fails to hold, the oversold bounce scenario would weaken, giving sellers a chance to push prices lower and continue the existing downtrend, despite new investment options entering the market.
What do the fundamentals reveal about SUI?
Looking past charts SUI price analysis is also supported by activity on network itself. The Sui ecosystem created by former members of Meta’s Diem and Libra projects has handled over $100 billion in stablecoin transfers in the past six months.
 SUI Price Analysis: Can ETF Launch Push SUI Back Above $1? 4
Decentralized exchanges on the network recorded $6.5 billion in trading volume over the last 30 days. Showing that on-chain usage remains active even while prices are low. These figures indicate that market sentiment has cooled but real network activity is still strong, a gap that traders often monitor closely.
Conclusion
SUI price analysis shows the market at a turning point. Falling leverage and the launch of a spot ETF are creating mixed pressures.
How the token moves next will depend on whether trading picks up and institutional money enters. For now, SUI is recovering cautiously, and traders are keeping a close eye on key support levels to see if they hold.
Disclaimer: This article is for informational purposes only and does not constitute financial advice. Cryptocurrency investments carry risks, and readers should conduct their own research or consult a licensed financial advisor before making any investment decisions.
Glossary
21Shares Spot SUI ETF: A Nasdaq-listed ETF giving regulated spot access to SUI.
Relative Strength Index: Indicator showing overbought or oversold momentum.
Oversold Condition: When heavy selling may signal rebound potential.
Open Interest: Total active derivative contracts in the market.
Bollinger Bands: Volatility bands plotted around a moving average.
Frequently Asked Questions About SUI Price Analysis
Has SUI recovered from its recent drop?
SUI has made a small daily gain but it is still in a larger downtrend.
How much has SUI fallen in the past month?
SUI has fallen by nearly 40% over the past month.
What does SUI price analysis say about the trend?
SUI price analysis shows that token remains under pressure even after small rebounds.
How can the ETF affect SUI’s price?
The ETF can make it easier for investors to buy SUI. nd may bring more institutional money into the market.
What needs to happen for SUI to move higher?
SUI needs to stay above $0.85 and break above $1 to confirm stronger recovery momentum.
Sources
Cryptonews
Coingape
Tradingview
Coinmarketcap
Coinglass
Read More: SUI Price Analysis: Can ETF Launch Push SUI Back Above $1?">SUI Price Analysis: Can ETF Launch Push SUI Back Above $1?


You May Also Like

Deere (DE) Stock Falls After Q2 Beat as Flat Farm Income Spooks Investors

Oman slashes budget deficit on higher hydrocarbon revenues

Gate Expands Global Trading Ecosystem As World Crypto Trading Competition Season 8 Sets New Engagement Milestones


