From the 2008 Crash to COVID-19: A Topological Analysis
Table of Links
I. Introduction
II. Methodology
III. TDA Approach to analyzing multiple time series
IV. Data Analyzed
V. Results and Discussion
A. Obtaining point cloud from stock price time-series
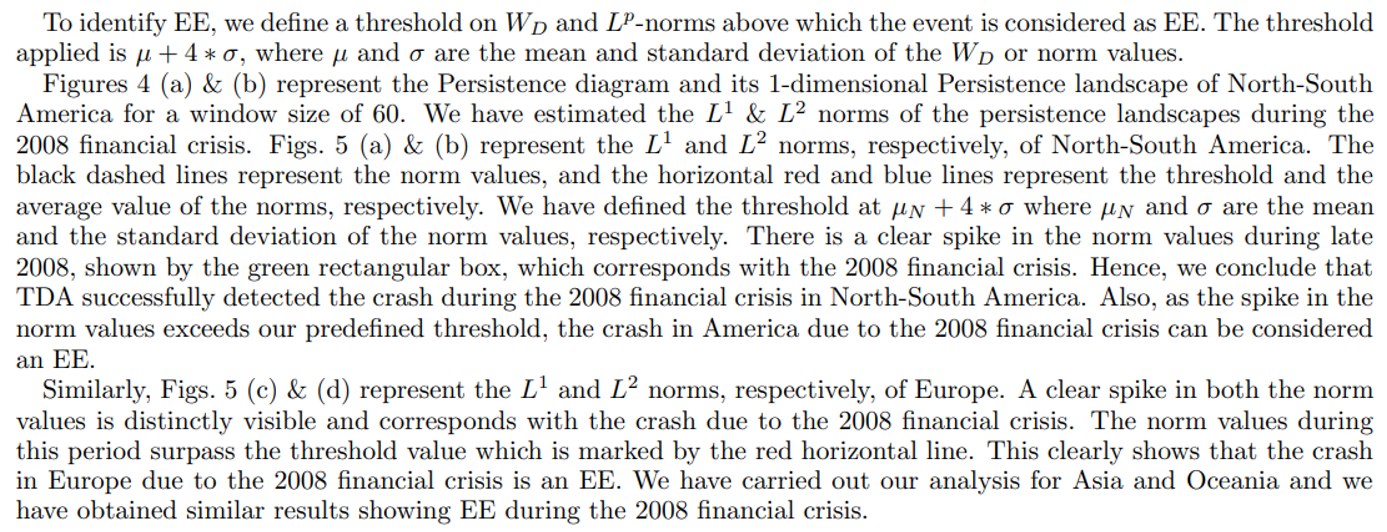
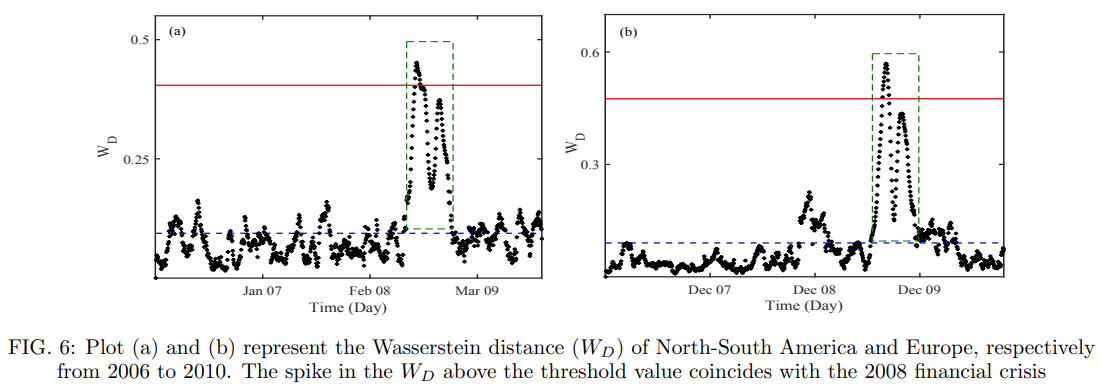
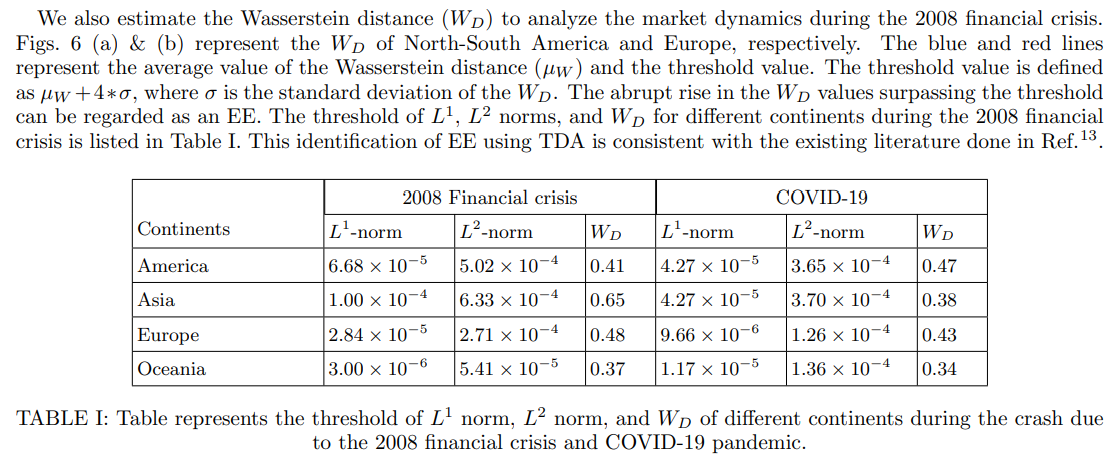
B. EE due to the 2008 Financial crisis
C. EE due to COVID-19 pandemic
D. Impact of COVID-19 on different Indian sectors
VI. Conclusion
VII. Acknowledgments and References
B. EE due to the 2008 Financial crisis
\ 
\ 
\
:::info Authors:
(1) Anish Rai, Department of Physics, National Institute of Technology Sikkim, Sikkim, India-737139;
(2) Buddha Nath Sharma, Department of Physics, National Institute of Technology Sikkim, Sikkim, India-737139;
(3) Salam Rabindrajit Luwang, Department of Physics, National Institute of Technology Sikkim, Sikkim, India-737139;
(4) Md.Nurujjaman, Department of Physics, National Institute of Technology Sikkim, Sikkim, India-737139;
(5) Sushovan Majhi, Data Science Program, George Washington University, USA, 20052.
:::
:::info This paper is available on arxiv under CC BY 4.0 DEED license.
:::
\


You May Also Like

Scott Bessent Urges Senate to Pass CLARITY Act Immediately

Solo Bitcoin Miner Achieves Stunning Victory, Defying 1-in-100,000 Odds to Mine Full Block