

Bitcoin Is Rebounding on Improving Demand – On-Chain Data Says Stay Cautious
Bitcoin’s recent climb to approximately $73,000, its highest level in roughly a month, is being driven by improving supply and demand conditions on-chain rather than the kind of structural shift that precedes sustained bull markets, according to a CryptoQuant report published this week.
What the Demand Data Actually Shows
CryptoQuant’s Bitcoin Apparent Demand metric estimates market demand by comparing new supply with long-term absorption. At the start of 2026, the metric fell to approximately negative 136,000 BTC, reflecting severe contraction in spot demand. It has since recovered to roughly negative 25,000 BTC.
 That improvement is meaningful. Demand contraction has eased considerably and the directional shift coincides with Bitcoin establishing price support since early February. But negative 25,000 BTC is still negative. Demand has improved significantly without turning positive, which is an important distinction when assessing whether the rebound has durable foundations.
U.S. spot demand is also showing early recovery signs. The Coinbase Premium Index, which tracks the price difference between Coinbase and global exchanges, has moved from deeply negative territory in early February to its highest level since October 2025. Renewed buying interest from U.S.-based investors is visible in the data, consistent with the taker buy volume spike during the U.S. market open on March 4 covered in earlier reporting this week.
Selling Pressure Is Easing
Two separate indicators suggest the selling side of the market is weakening. Trader unrealized losses have reached levels last seen in July 2022, a condition that historically reduces incentives to sell. Holders sitting on losses are less likely to realize those losses by selling, which removes supply pressure from the market even without new demand arriving.
Long-term holder distribution has also slowed sharply. The 30-day selling pace dropped from approximately 904,000 BTC in November 2025 to roughly 276,000 BTC today. That is a 69% reduction in long-term holder selling over roughly four months. Less supply hitting the market from long-term holders combined with easing demand contraction is what produced the price recovery. Neither is the same as strong new demand entering the market.
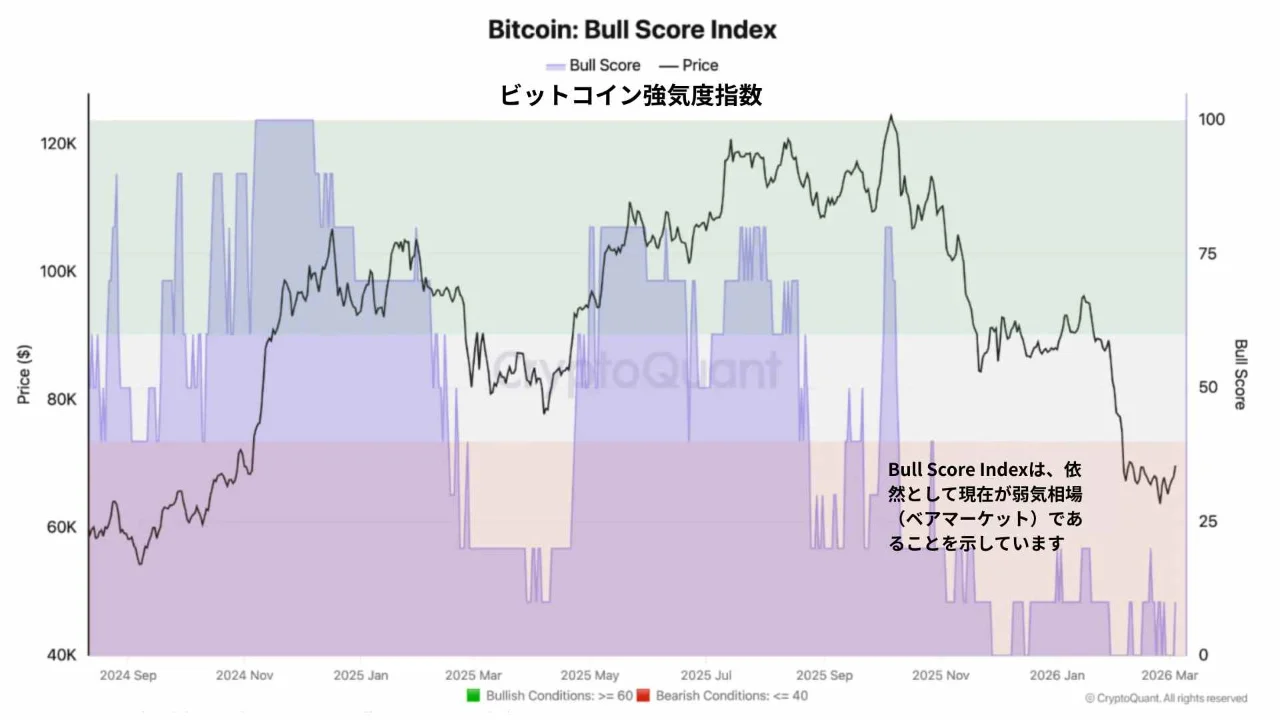
Why the Bull Score Matters
Despite all of the above improvements, CryptoQuant’s Bitcoin Bull Score Index sits at 10 out of 100. Historically, readings at this level are associated with bear market conditions rather than bull market conditions. The index aggregates multiple on-chain signals into a single composite reading, and a score of 10 means the broader market structure remains fragile even as individual indicators improve.
The honest interpretation the data supports is a relief rally inside an ongoing bear market rather than the beginning of a new sustained uptrend. Relief rallies can be significant in magnitude and duration. They can also reverse without warning when the conditions driving them, easing selling pressure and modest demand recovery, run their course.
Bitcoin at $73,000 is a better position than Bitcoin at $63,000. It is not the same thing as Bitcoin resuming a bull market. The on-chain data is clear about the difference.
The post Bitcoin Is Rebounding on Improving Demand – On-Chain Data Says Stay Cautious appeared first on ETHNews.


You May Also Like

Trump Impeachment Odds Surge to 66%

Security Sucks in General Nowadays. Blockchains Just Tend To Have an Immediate Payoff


