

SUI Is Sitting on a Fibonacci Level That Previously Launched a 1,000% Rally

SUI is trading at $0.8964 on Binance, sitting at the 0.786 Fibonacci retracement level where an identical structure in 2024 preceded a move of over 1,000%, according to analyst CryptoPatel.
What the Chart Shows
The weekly SUI/USDT chart, sahred by him, covers mid-2023 through a projected 2027 timeline. The price history breaks into two distinct phases visible from left to right.
The first phase runs from late 2023 into mid-2024. SUI bottomed near the 1.0 Fibonacci level around $0.36, marked on the chart as the accumulation zone. From there it launched to $4.7812, a 1,035.59% move, before distributing and rolling over. That peak is annotated in the blue box on the left side of the chart.
The second phase is the current setup. SUI has retraced from that high back into the green accumulation zone, now sitting at the 0.786 Fibonacci level around $0.7828. A pink resistance line runs diagonally from the 2024 highs. A red ascending trendline runs from the 2023 lows, providing macro support from below. Current price at $0.8964 sits between those two lines, compressing into the accumulation zone.
The S/R level marked in red horizontal band around $1.80 to $2.00 is the first structural resistance above current price. That level previously acted as support before breaking down and would need to be reclaimed for the bullish structure to develop.
The Fractal Argument
CryptoPatel (@CryptoPatel) posted the analysis on March 7, 2026, identifying what he describes as an identical structure to the 2024 accumulation phase. The fractal argument rests on three elements converging at the current price level. The 0.786 Fibonacci retracement, which is one of the deepest standard retracement levels and typically marks either the last support before invalidation or a high-conviction reversal zone. The macro ascending trendline providing support from below. And the current price compression into the accumulation zone where the prior 1,035% move originated.
The 2024 move peaked at $4.7812 from a base near $0.36. The second projected expansion on the chart reaches $19.1313, annotated as a 2,452.11% move from the current accumulation zone. That is the basis for the 25x claim from current price near $0.8964, which would place the Target 4 level at $20.
The Four Targets and the Invalidation
CryptoPatel maps four upside targets above the current level. Target 1 sits at $1.80, Target 2 at $4.00, Target 3 at $10, and Target 4 at $20. The projected timeline extends through mid-2027, making this a multi-cycle thesis rather than a near-term trade.
The invalidation is precise. A weekly candle close below $0.50 ends the setup entirely. Current price at $0.8964 sits roughly 44% above that level. The accumulation zone holds between approximately $0.71 and $0.78, providing a buffer before the invalidation line becomes relevant.
The $0.50 level must hold on a weekly close basis. Everything above it keeps the fractal intact.
What the Setup Requires
The fractal is compelling on structure. It requires the 2024 pattern to repeat with similar magnitude from a similar technical configuration. Prior fractal setups in crypto have both succeeded and failed at this stage. The 0.786 Fibonacci level holding as support is the first confirmation. Reclaiming the S/R band around $1.80 would be the second.
Neither has happened yet. The accumulation zone is holding. The trigger has not been reached.
The post SUI Is Sitting on a Fibonacci Level That Previously Launched a 1,000% Rally appeared first on ETHNews.


You May Also Like
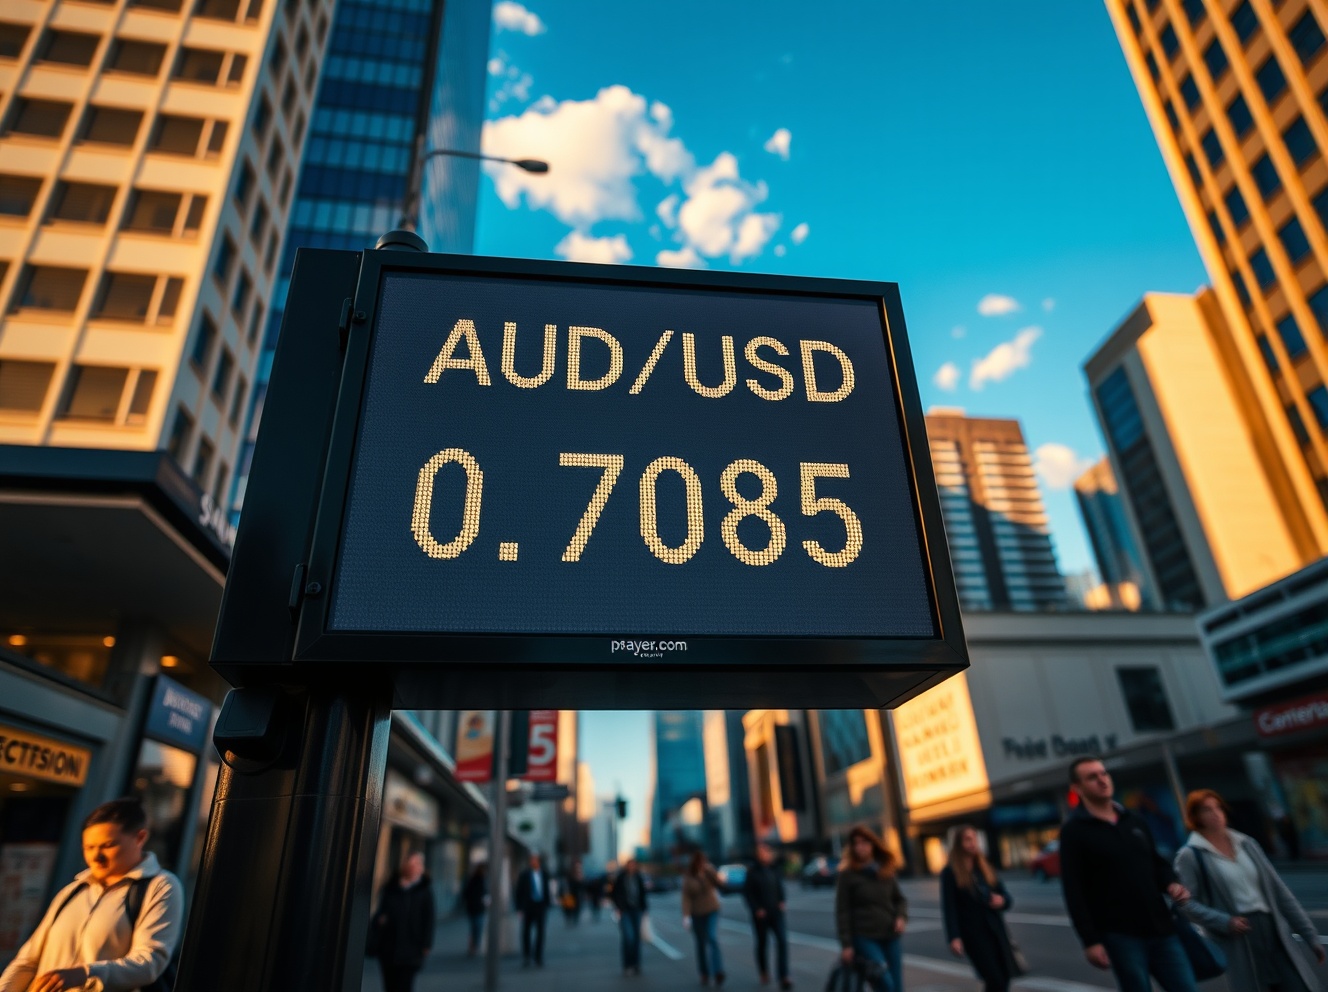
Australian Dollar Dips Below 0.7100 as Middle East Tensions Weigh on Risk Sentiment

Fed Governor Calls For Strong Stablecoin Oversight As CLARITY Act’s Final Text Gets Delayed


