ETH Liquidity Hits Record $163.5B: Is a Big Rally Coming?
TL;DR
- Ethereum stablecoin liquidity hits $163.5B, with $99.1M revenue showing strong demand for blockspace.
- ETH trades sideways near $4,360, key resistance at $4,500, support zones at $4,200–$3,880.
- The accumulation map shows ETH near the “Steady” zone, historically linked to long-term investor positioning.
Stablecoin Liquidity and Network Revenue
Ethereum’s stablecoin supply has climbed to a record $163.5 billion in September 2025, up from $152 billion in August. The increase marks one of the strongest liquidity inflows to the network this year and supports activity across decentralized finance and trading platforms.
Ethereum also generated $99.1 million in network revenue over the past 180 days. The figure reflects steady demand for blockspace as users continue to pay transaction fees. Analyst Cipher X commented,
Meanwhile, Ethereum remains the largest platform for DeFi, the total value locked standing at $90.9 billion. According to DefiLlama, this amount has slightly gone down in the last 24 hours, though overall levels are still close to yearly highs.
 Source: DefiLlama
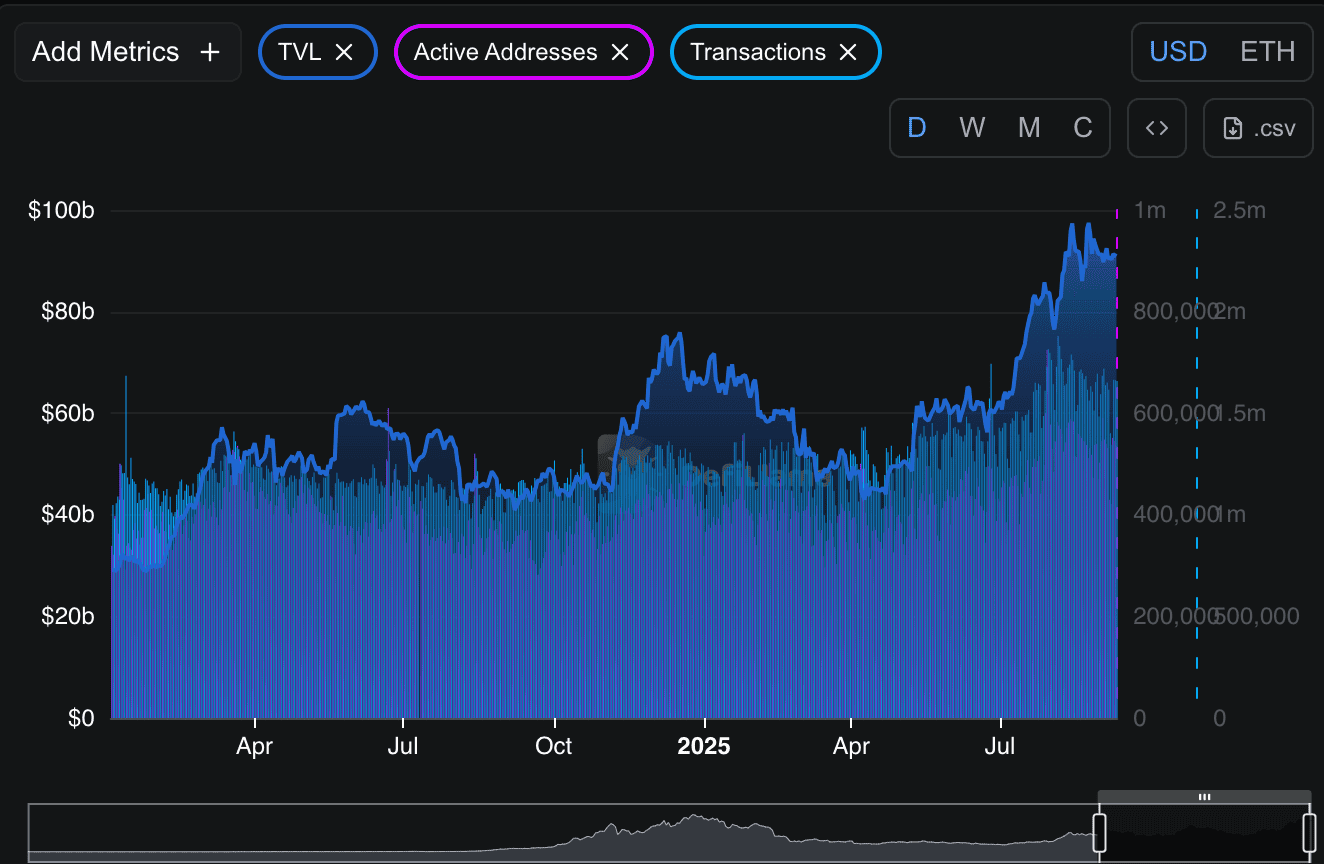
In addition, user movement is active. The network recorded 540,717 active addresses in one day alongside 64,794 new addresses. Daily transactions stood at 1.66 million, indicating a constant demand across applications such as lending, staking, and trading.
Trading Range and Market Outlook
ETH was trading at around $4,360 after nearly two weeks of sideways movement. Resistance sits at $4,500, with a potential move higher targeting $4,883. On the downside, support is seen between $4,200 and $4,100, with deeper levels at $4,060 and $3,880.
Crypto analyst Ted noted,
He also highlighted that Ethereum generated $1.4 million in fees yesterday, the highest among all blockchains.
Long-Term Accumulation Perspective
A fresh monthly MACD crossover has appeared on Ethereum’s chart, which some traders view as a long-term shift after extended consolidation. Merlijn The Trader called it a “monster ignition,” suggesting renewed momentum.
Merlijn also shared an accumulation map, showing ETH near $4,362 in the “Steady” band, just above “Still Cheap.” This area has historically aligned with accumulation phases for long-term holders and larger investors. The upper red zones, labeled “HODL” and “Take Profit,” have coincided in past cycles with retail-driven rallies and profit-taking.
With record liquidity, strong user activity, and technical signals aligning, Ethereum is at a point where its next move depends on whether price breaks above $4,500 or falls back toward lower support.
The post ETH Liquidity Hits Record $163.5B: Is a Big Rally Coming? appeared first on CryptoPotato.


You May Also Like

The Fake Website That Triggered an Arrest in the CoinDCX Case
![[OPINYON] Hindi lang salamin ng lipunan ang panitikan](https://www.rappler.com/tachyon/2026/04/Matagal-nang-di-lang-salamin-ng-lipunan-ang-panitikan.jpg)
[OPINYON] Hindi lang salamin ng lipunan ang panitikan