TLDR SOL is trading around $88, holding a key trend line support after pulling back from $95 The Fear and Greed Index dropped to 30 (Fear) following Jerome PowellTLDR SOL is trading around $88, holding a key trend line support after pulling back from $95 The Fear and Greed Index dropped to 30 (Fear) following Jerome Powell

Solana (SOL) Price: SOL Holds Bullish Structure as RWA Ecosystem Tops $1.8B

2026/03/21 15:36
3 min read
For feedback or concerns regarding this content, please contact us at crypto.news@mexc.com

TLDR

  • SOL is trading around $88, holding a key trend line support after pulling back from $95
  • The Fear and Greed Index dropped to 30 (Fear) following Jerome Powell’s comments on the Iran war’s economic impact
  • Solana processed over 880 million transactions last week, but network fees remain low at $4.6 million weekly
  • Solana’s real-world asset (RWA) ecosystem has surpassed $1.82 billion in tokenized value, with RWA DeFi TVL hitting $465 million
  • Analysts point to the $50–$80 range as a key accumulation zone, with some long-term price targets between $500 and $1,000

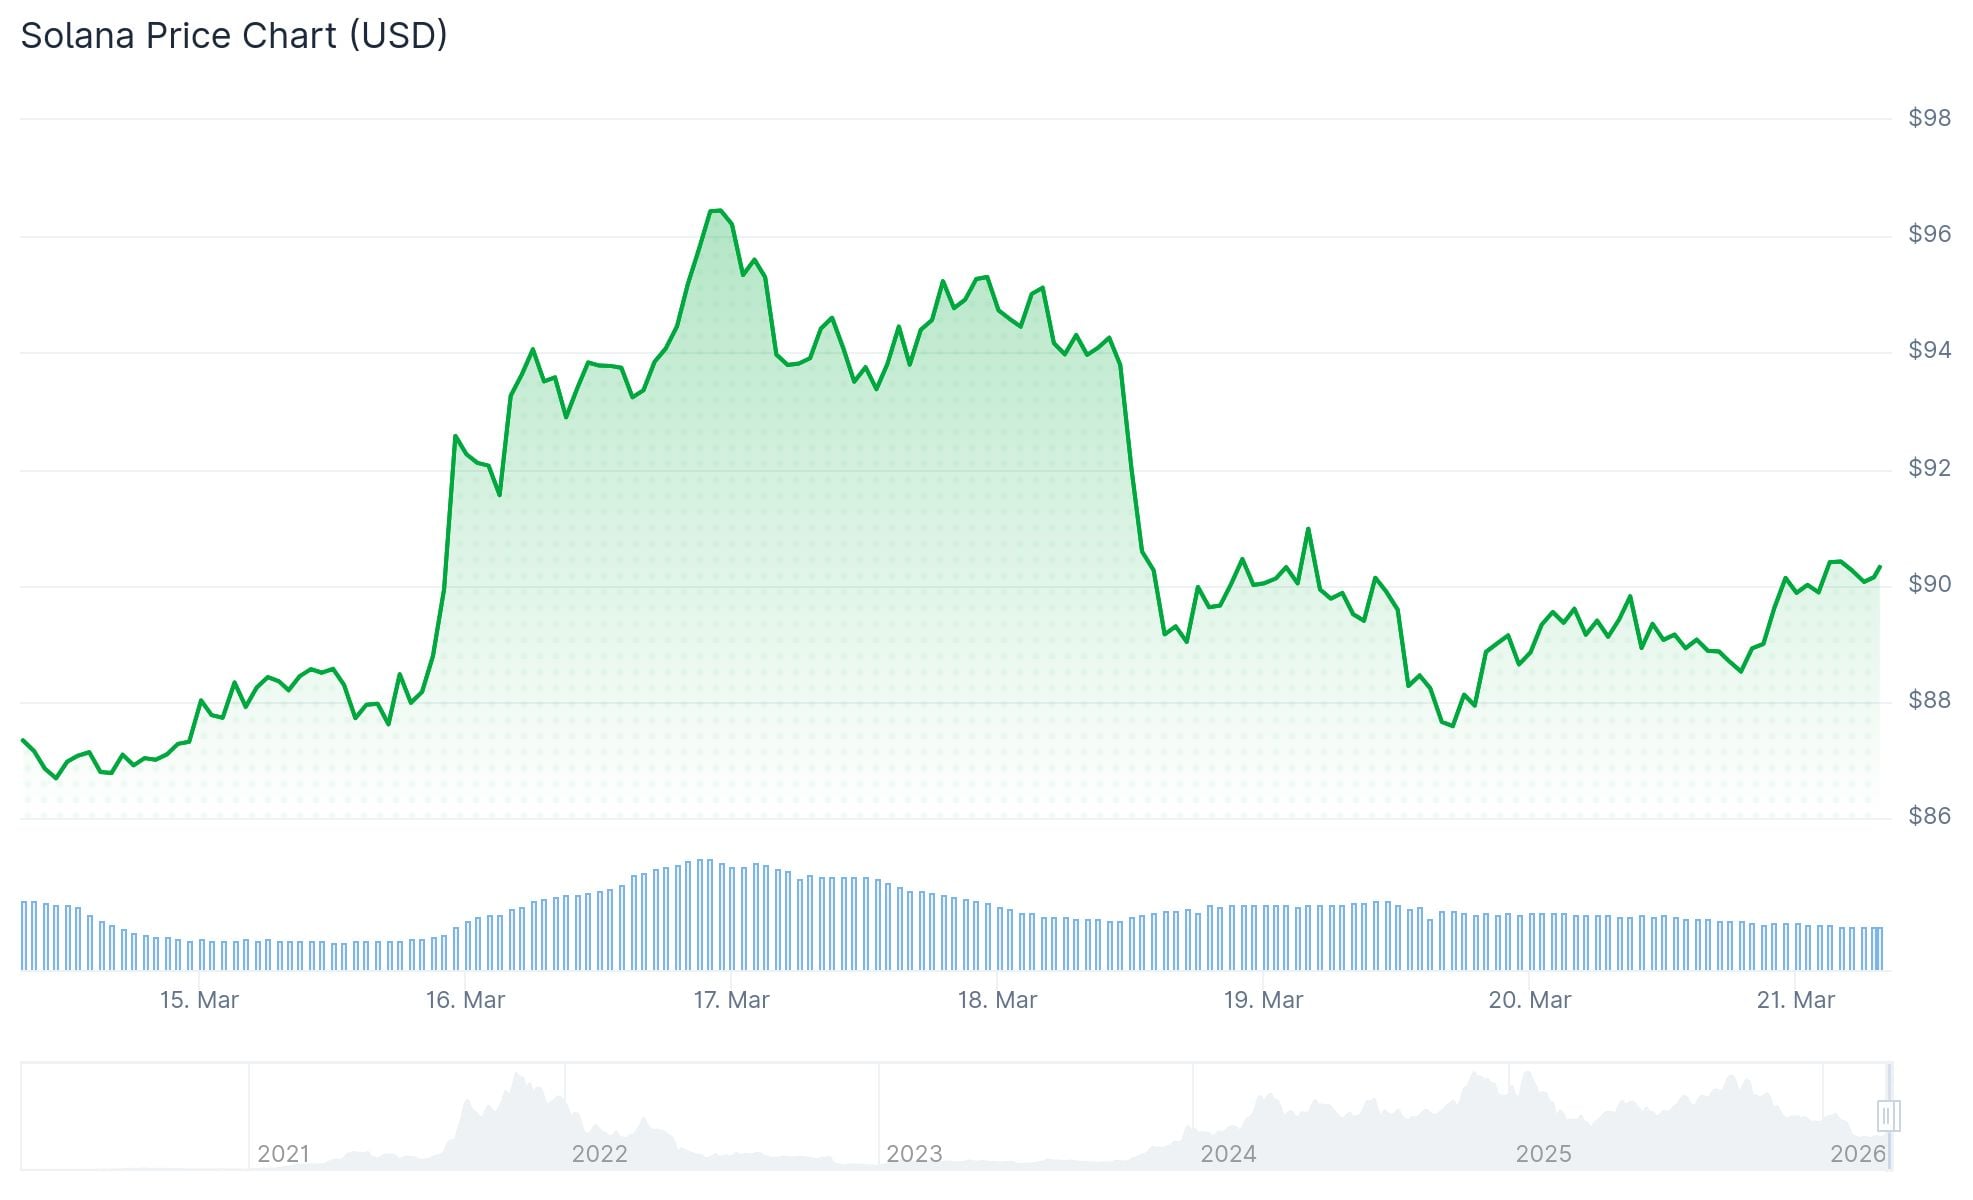
Solana is holding around $88 after pulling back from a high of $95. The token is sitting on a key trend line support that traders are watching closely.

Solana (SOL) PriceSolana (SOL) Price

Trading volume has dropped to $3.3 billion, down from $6.5 billion on March 16 when SOL briefly touched $95. Bulls appear to be taking profits early during rallies as broader market sentiment turns cautious.

The Crypto Fear and Greed Index fell from 46 (Neutral) to 30 (Fear) after Federal Reserve Chair Jerome Powell said the economic impact of the Iran war remains “uncertain.” A potential spike in oil prices could push inflation higher, which might delay or cancel Fed rate cuts this year.

On-Chain Activity vs. Fees

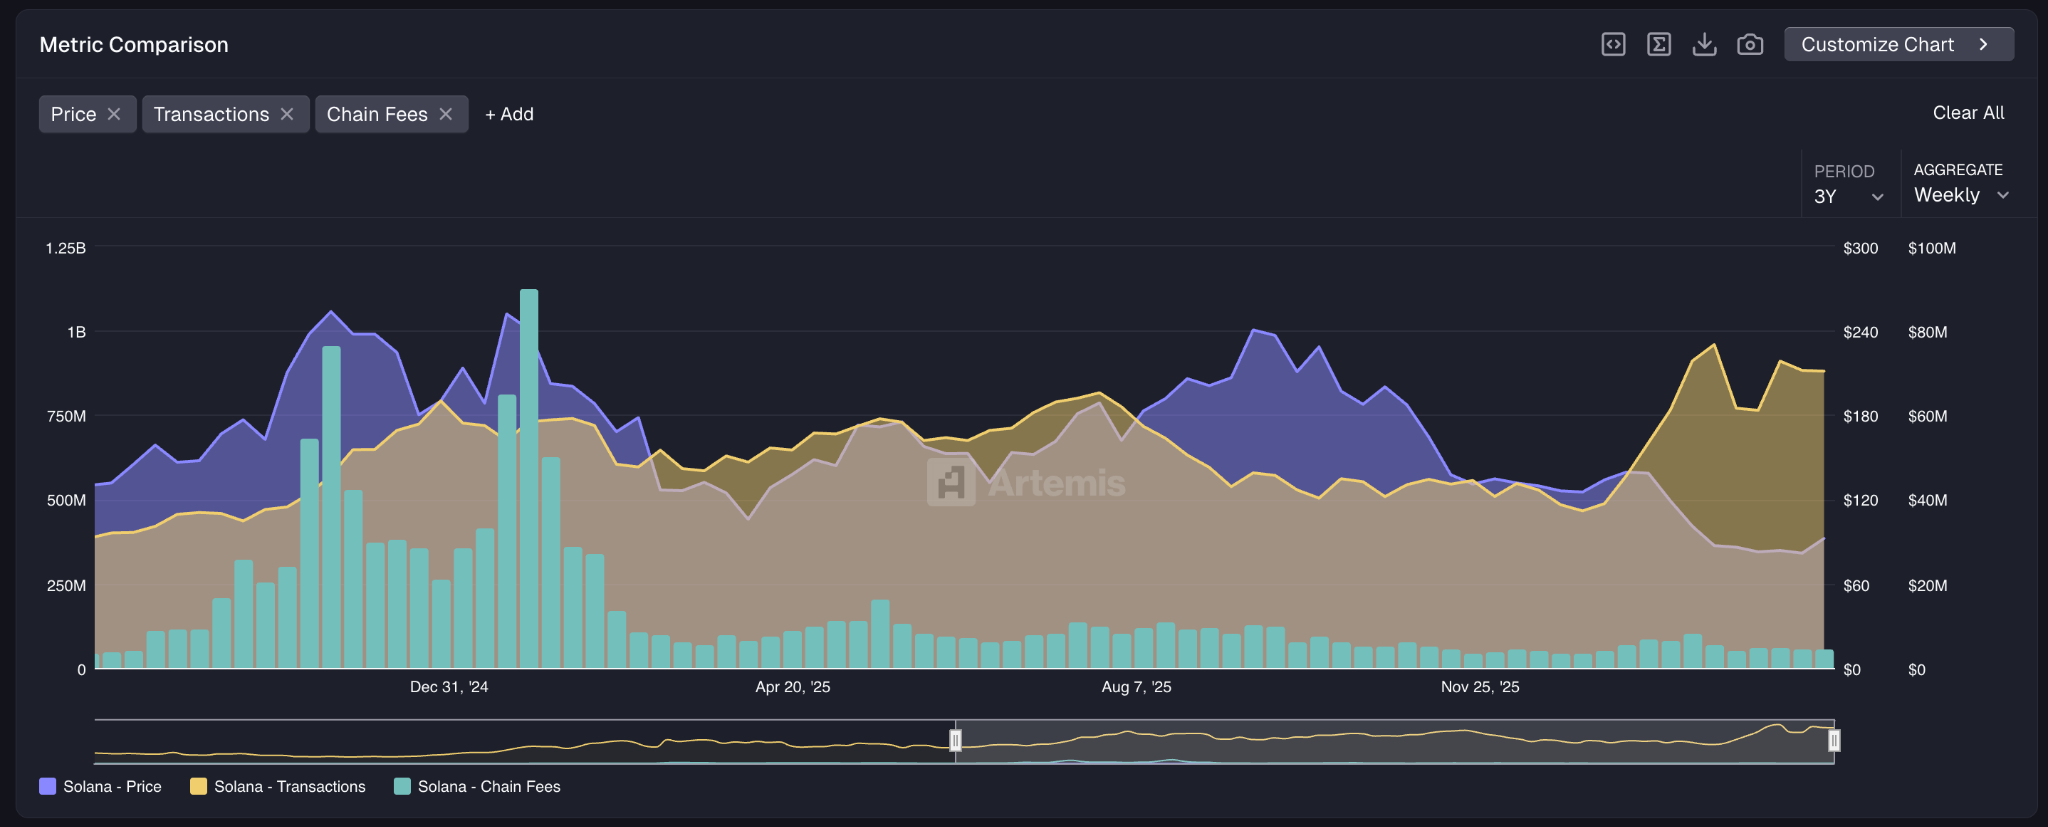
Solana processed over 880 million transactions last week. That is only slightly below its record of 959 million set during the week ending February 8.

solana on-chain dataSource: Artemis

Despite the high activity, weekly network fees came in at just $4.6 million. That is 50% lower than what Solana collected during its June–September 2025 rally, when transaction counts were actually lower at 700–800 million per week.

Lower fees generally point to a lower network valuation. Analysts view the current gap between transaction volume and fee revenue as a bearish signal in the medium term.

On the price chart, SOL faces a hard stop at $87. A break below that level could send the token toward $77, an 11.5% decline. If it holds and a high-volume candle appears during the U.S. trading session, that could open the door to a move back toward $100.

RWA Ecosystem Hits $1.82 Billion

Solana’s real-world asset ecosystem crossed $1.82 billion in tokenized value on March 20. This includes tokenized debt, equities, and funds brought onto the blockchain.

RWA-backed DeFi protocols on Solana reached an all-time high of $465 million in total value locked. While Solana still sits behind Ethereum in overall RWA market size, it is growing its presence in this space.

Crypto analyst Crypto Patel posted on X that the monthly chart shows a confirmed breakout, a successful retest, and well-held support levels. Patel highlighted that Fibonacci retracement levels are in place and called the $50–$80 range a rare accumulation zone. Based on historical patterns, Patel suggested SOL could reach $500–$1,000 if previous cycles repeat.

SOL is currently trading near $88, with the $87 support level being the key line to watch in the near term.

The post Solana (SOL) Price: SOL Holds Bullish Structure as RWA Ecosystem Tops $1.8B appeared first on CoinCentral.

Market Opportunity
Solana Logo
Solana Price(SOL)
$89.97
$89.97$89.97
+1.13%
USD
Solana (SOL) Live Price Chart
Disclaimer: The articles reposted on this site are sourced from public platforms and are provided for informational purposes only. They do not necessarily reflect the views of MEXC. All rights remain with the original authors. If you believe any content infringes on third-party rights, please contact crypto.news@mexc.com for removal. MEXC makes no guarantees regarding the accuracy, completeness, or timeliness of the content and is not responsible for any actions taken based on the information provided. The content does not constitute financial, legal, or other professional advice, nor should it be considered a recommendation or endorsement by MEXC.

You May Also Like

Spot Bitcoin ETFs Face Outflows Despite Strong March Inflows

Spot Bitcoin ETFs Face Outflows Despite Strong March Inflows

Spot Bitcoin ETFs continue to attract attention as market dynamics shift rapidly. Recent data shows a short term pullback in investor activity. However, the broader
Share
Coinfomania2026/03/21 18:45
Strategy CEO: If Morgan Stanley allocates 2% to Bitcoin, it will bring in approximately $160 billion in funds.

Strategy CEO: If Morgan Stanley allocates 2% to Bitcoin, it will bring in approximately $160 billion in funds.

PANews reported on March 21 that, regarding Morgan Stanley's second revised S-1 filing for a spot Bitcoin ETF, Strategy CEO Phong Le stated that Morgan Stanley
Share
PANews2026/03/21 17:58
Fed’s 25bps cut sparks Bitcoin repricing: October breakout ahead?

Fed’s 25bps cut sparks Bitcoin repricing: October breakout ahead?

The post Fed’s 25bps cut sparks Bitcoin repricing: October breakout ahead? appeared on BitcoinEthereumNews.com. Journalist Posted: September 18, 2025 Key Takeaways How is BTC reacting to the Fed’s rate cut? Bitcoin is grinding +0.72%, range-bound, with flows measured and a potential long squeeze in play. What’s setting up Bitcoin for year-end? Dovish Fed signals, seasonal tailwinds, and aligned macro flows keep BTC primed for a potential ATH. No parabolic moves, just Bitcoin [BTC] grinding +0.72% intraday as the FOMC delivers its first 25 bps cut of 2025. The tape is cautious, with range-bound action signaling traders are sitting tight. What’s the takeaway? Market participants are still sizing up Q4, with Fed Chair Powell’s mixed signals on future rate cuts keeping flows measured, as Matt Mena, Crypto Research Strategist at 21Shares, told AMBCrypto. “The cut itself was widely priced in – what mattered more was the Fed’s updated dot plot. Futures markets had been discounting only a 50% chance of 4–5 cuts through the end of next year.” He added, “While today’s 25bps cut provided the spark, it is the path implied by the dots – more than the cut itself – that may set the stage for Bitcoin to challenge new highs into year-end.” Fed’s dot plot shapes BTC’s long-term positioning Bitcoin traders are leaning on the Fed’s dot plot to size up positioning.  According to the latest projections, the Fed is signaling two more 25bps cuts by year-end, pushing the target range down to 3.50%–3.75% from 4.00%–4.25%. In short, Bitcoin’s long-term positioning remains dovish. Powell’s inflation caution capped the short-term squeeze, keeping the tape range-bound. Yet the dot plot shows most Fed officials leaning toward two more cuts, keeping BTC positioned to grind toward new highs by year-end. “The dots leaned more dovish, signaling the Fed is open to accelerating the pace of easing if conditions demand it. That repricing risk is now…
Share
BitcoinEthereumNews2025/09/18 22:27