Bitcoin ETF Inflows Rebound as Market Volatility Spikes
Spot Bitcoin ETFs have swung back to net inflows in late March 2026 after weeks of sustained outflows, with institutional buyers stepping in even as price volatility across crypto markets intensifies.
ETF Inflows Return After Weeks of Outflows
U.S. spot Bitcoin ETFs have recorded roughly $2.5 billion in net inflows during March, putting the products on track to recover losses accumulated earlier in 2026. The reversal follows a prolonged stretch of outflows that had raised questions about institutional appetite for Bitcoin exposure.
The turnaround became clearer on March 25, when spot Bitcoin ETFs collectively pulled in $167 million in a single session, snapping a multi-day outflow streak. BlackRock’s IBIT has consistently ranked among the top contributors to net inflow days throughout Q1.
The cumulative March figure is notable because it suggests the January and February outflow cycle, which at one point erased early-month gains across several ETF products, may have been a temporary positioning adjustment rather than a structural shift in demand.
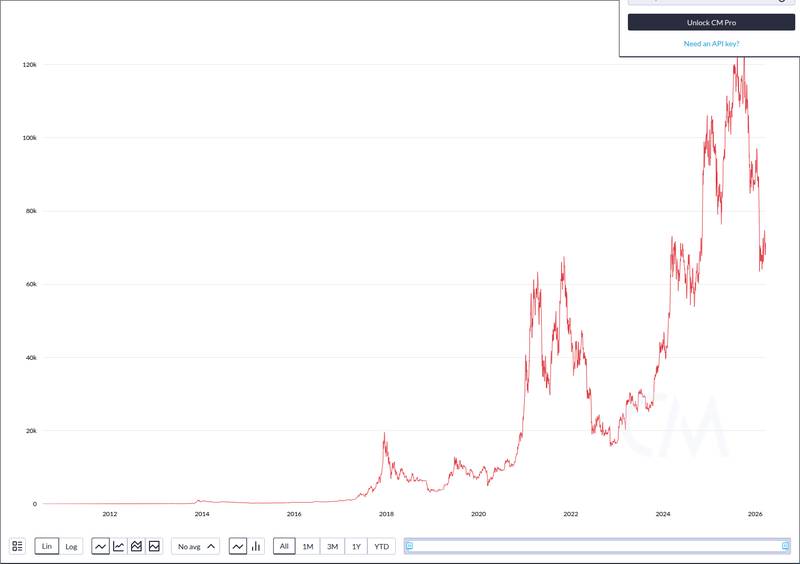
 CoinGecko visual captured from https://www.coingecko.com/en/coins/bitcoin. Spot market baseline for Bitcoin.
Volatility Spike Frames the Timing
What makes the inflow rebound unusual is the backdrop against which it is occurring. Bitcoin has experienced sharp intraday swings throughout the second half of March, with broader macro uncertainty fueling leveraged positioning across derivatives markets.
Multiple sessions in the past two weeks saw BTC price swings exceeding 3-4% within hours, driven partly by reactions to Federal Reserve commentary and shifting rate expectations. Liquidation cascades on both sides have added to the choppiness.
The fact that ETF inflows are recovering during elevated volatility, rather than during calm trending conditions, suggests that the capital flowing into these products is not momentum-chasing retail demand. Institutional allocators using regulated ETF wrappers appear willing to absorb short-term price risk at current levels.
 CoinMetrics visual captured from https://charts.coinmetrics.io/crypto-data. On-chain metrics context for Bitcoin.
Dip-Buying Pattern Echoes Prior Cycles
The March inflow recovery fits a pattern that has played out repeatedly since spot Bitcoin ETFs launched in January 2024. Periods of sustained outflows tied to macro events or price drawdowns have historically been followed by sharp inflow rebounds once prices stabilize or dip to levels that institutional buyers view as attractive entry points.
In Q4 2025, a similar dynamic unfolded when ETF outflows during a correction were followed by record weekly inflows as BTC recovered. The pattern suggests that large allocators are treating volatility-driven dips as accumulation windows rather than signals to reduce exposure.
Falling exchange supply has reinforced this interpretation. As exchange-held Bitcoin supply declines, the combination of ETF-driven demand and reduced available liquidity on spot markets creates structural support for price floors during drawdowns.
Whether the current inflow pace holds will likely depend on how markets digest the next round of U.S. economic data releases and any further Fed guidance on rate policy. The next FOMC meeting and upcoming CPI print are the two scheduled catalysts that ETF flow watchers are tracking most closely.
Disclaimer: This article is for informational purposes only and does not constitute financial or investment advice. Cryptocurrency and digital asset markets carry significant risk. Always do your own research before making decisions.


You May Also Like

Trump treating DC like 'personal property' to abuse when he gets bored: analysis

Markets, AI Rally Rattled as Trump Calls Iran Ceasefire “On Life Support”