

Decoding the DEX landscape in 2025: Public chain landscape, liquidity dynamics, and institutional trends
Decentralized exchanges (DEXs) continue to reshape cryptocurrency trading, experiencing significant growth in trading volume, total value locked (TVL), and institutional interest. Key examples include Uniswap's launch of its v4 upgrade and "hooks" mechanism, which reduced gas fees and increased user flexibility, and PancakeSwap's record monthly trading volume in June 2025. These developments signal the deep maturity of the DeFi sector.
Core Data Summary
- In the second quarter of 2025, the global DeFi protocol TVL reached US$123.6 billion, a year-on-year increase of 41%.
- Ethereum maintains its dominance, accounting for approximately 63% of the total TVL of DeFi protocols (approximately US$78.1 billion) by mid-2025.
- PancakeSwap's trading volume in June 2025 reached US$325 billion, setting a record for the highest single-month volume.
- As of mid-2025, Uniswap’s TVL across all supported chains is approximately $4.5 billion.
- As of the second quarter of 2025, the total market capitalization of the top 100 DeFi tokens was approximately $98.4 billion.
- PancakeSwap recorded 7.4 million unique users in the second quarter of 2025.
1. DEX Dynamics
Uniswap launched v4 in early 2025, introducing a hook mechanism, singleton design, and gas optimization. By directly supporting ETH and reducing reliance on WETH, v4 reduced gas costs and improved transaction efficiency. Within approximately 177 days of its launch, the platform's TVL reached $1 billion, growing faster than v3 during the same period.
PancakeSwap's trading volume reached $325 billion in June 2025, nearly double the data in May, setting a new monthly record.
Thanks to low fees (approximately $0.0025 per transaction) and fast block times (approximately 400 milliseconds), Solana developer activity reportedly increased 200% year-over-year. Institutional funds (such as Franklin Templeton) are increasing their allocation to DeFi on chains like Solana.
Large-scale cross-chain activity has increased, particularly represented by the growth of Arbitrum, BNB Chain, Optimism, and Base.
2. User Base and Adoption Trends
By mid-2025, over 14.2 million unique wallets will interact with DeFi protocols. The average daily trading volume of some major DEXs fluctuates between $1 billion and $2 billion, depending on market volatility. DEX aggregators and routing volume are growing, with 1inch and Matcha routing over $3.9 billion weekly.
The average weekly trading volume of DEXs in the second quarter of 2025 was US$18.6 billion, a year-on-year increase of approximately 33%. Among them, PancakeSwap had 7.4 million unique users in the second quarter of 2025.
By mid-2025, over 9.7 million unique wallets will interact with decentralized exchanges (DEXs), up from approximately 6.8 million last year. Institutional interest (funds, ETFs) is growing, with a particular focus on scalable chains like Solana and Arbitrum.
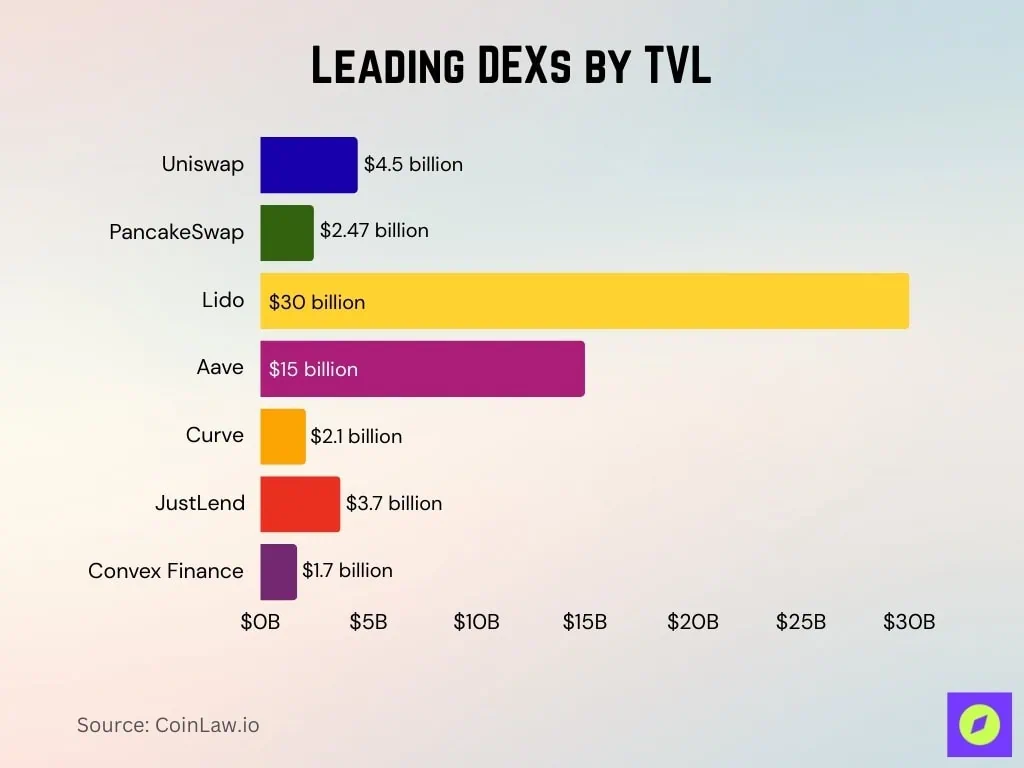
3. Mainstream DEXs ranked by total locked value (TVL)
By mid-2025
- Uniswap's cross-chain TVL is approximately US$4.5 billion.
- PancakeSwap’s TVL is approximately $2.47 billion, most of which is located on the BNB Chain (approximately $2.18 billion).
- Lido leads the DeFi platform with approximately $30 billion in TVL, followed by Aave (approximately $15 billion) and Uniswap (approximately $10 billion).
- Curve Finance TVL is approximately US$2.1 billion.
- JustLend’s TVL is approximately $3.7 billion.
- Convex Finance reports a TVL of approximately $1.7 billion.
4. Mainstream trading pairs on DEX
The BTC/USDT trading pair remains at the top of most DEXs. ETH/USDC and ETH/USDT continue to rank among the top three in terms of trading volume on Ethereum DEXs.
On Solana DEXs such as Orca, SOL/USDC and SOL/USDT lead daily trading volume, with SOL-related trading pairs dominating.
On Uniswap V4, high-liquidity pools primarily focus on stablecoin swaps and ETH/stablecoin pairs. The BNB/USDT trading pair is popular on BNB Chain and multi-chain DEXs, connecting to the BNB ecosystem token.
On chain-agnostic aggregators, cross-chain/multi-hop transaction pairs involving USDT, USDC, or ETH frequently appear.
On derivatives DEXs such as dYdX, BTC perpetual contracts against USD stablecoins and ETH perpetual contracts against USD are still mainstream trading pairs.
5. Fee structure and cost comparison
Most DEX standard pool exchange fees range from 0.20% to 0.30%. Some stablecoin pools have lower fees, typically around 0.02% to 0.05%.
Most of the exchange fees go to liquidity providers, and a small portion goes into the protocol treasury.
Some emerging DEXs are experimenting with 0% maker fees or subsidized fees to attract liquidity. On derivatives platforms like dYdX, maker and taker fees are typically at a low basis point level.
Gas and network fees remain a significant cost for many users. Aggregators sometimes reduce effective costs by routing transactions to cheaper pools.
Some DEXs adopt a flexible fee model, with higher fees for volatile trading pairs and lower fees for stablecoin pairs.
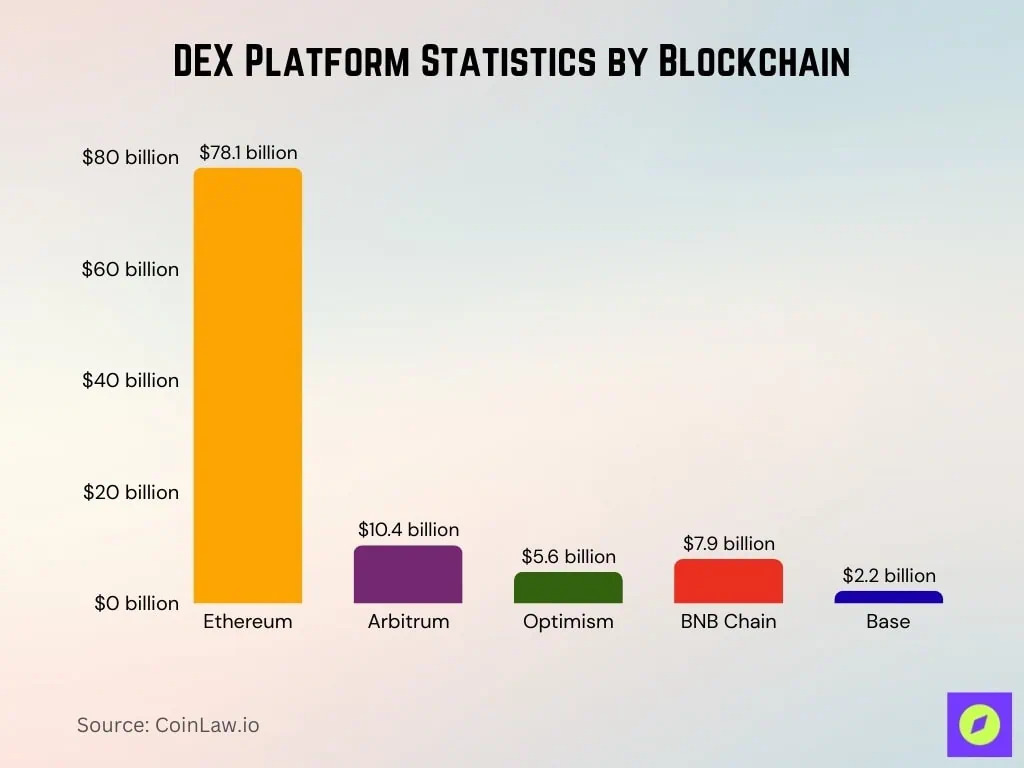
6. DEX platform data by blockchain
- Ethereum: The TVL of DeFi protocols is approximately US$78.1 billion, accounting for approximately 63% of the total TVL of DeFi.
- Arbitrum: TVL is approximately US$10.4 billion, an increase of approximately 70% year-on-year.
- Optimism: TVL is approximately US$5.6 billion, more than doubling from approximately US$2.3 billion in 2024.
- BNB Chain: TVL grew modestly to approximately $7.9 billion.
- Base: TVL of approximately $2.2 billion, growing continuously since launch.
- Solana: Strong DEX activity, including high trading volume, high DEX usage share, and technical appeal (low fees, fast block times).
- Trading volume distribution: Approximately 67.5% of Uniswap’s daily trading volume now occurs on the second-layer network.
- PancakeSwap: Dominates the BNB Chain, but its TVL composition also supports cross-chain activities.
- Liquidity staking protocols: Although not strictly a DEX, they account for a significant portion of the TVL on chains like Ethereum.
7. Liquidity Depth and Slippage Rate
Stablecoin pools and major asset pairs have deeper liquidity. For tokens with higher volatility or lower liquidity, slippage can be significant, ranging from 0.3% to over 1%.
Pooled liquidity models reduce slippage by concentrating liquidity in active price zones. Smart routing and aggregator tools reduce slippage by splitting trades across multiple pools.
In fast-moving markets, slippage can easily spike due to shallow liquidity and MEV activity. Average daily slippage for large trades on major DEXs has decreased compared to previous years. Many high-liquidity pools offer extremely tight spreads, often just a few basis points.
The effective costs for traders include slippage, gas fees, routing fees, and exchange fees.
8. Cross-chain and multi-chain DEX activities
In 2025, DEX trading volume will increase by approximately 37%, with an average monthly trading volume of approximately US$412 billion.
Ethereum-based DEXs account for approximately 87% of decentralized trading volume. Solana DEX processes over $1.5 billion in daily trading volume, demonstrating strong competitiveness. Chains such as BNB Chain, Polygon, Base, Arbitrum, and Optimism are growing in importance.
Cross-chain DEXs and bridges are increasingly used for arbitrage and liquidity migration, while aggregators supporting multiple chains are seeing increased usage as users seek the best rates.
Liquidity fragmentation remains a challenge. Some multi-chain DEXs have introduced incentives to attract liquidity to less-used chains.
9. Key data of the decentralized storage market
The global decentralized storage market size was US$622.9 million in 2024 and is expected to reach US$4.5 billion in 2034.
The market is projected to expand at a robust compound annual growth rate (CAGR) of 22.4% from 2025 to 2034. The public cloud segment alone is projected to exceed $2 billion by 2034. The enterprise segment will account for 45% of the market share in 2024, reflecting strong institutional adoption.
North America will account for 40% of the market share in 2024 and is the leading region in decentralized storage adoption.
10. Aggregators and Routing Volume
Weekly volume routed through aggregators like 1inch and Matcha exceeds $3.9 billion. The 30-day average trading volume on 1inch is approximately $8.6 billion. Market share among Ethereum DEX aggregators is becoming increasingly concentrated.
Aggregators act as middleware, becoming the gateway for institutional funds, improving execution through gas optimization, MEV protection, and cross-chain routing. Some aggregators are building KYC and compliance features to attract institutions.
Aggregate routing often spans multiple chains, increasing bridging risk and complexity.
11. Smart Contract Audits and Security Incidents
In the first quarter of 2025, Web3 lost over $2 billion due to vulnerabilities and attacks. In August 2025, 16 security incidents resulted in the theft of a total of $163 million.
- Cetus DEX was hacked in May 2025, resulting in losses of approximately $223-260 million.
- New Gold Protocol lost $2 million due to a flash loan vulnerability.
- Nemo Protocol on Sui suffered an approximately $2.6 million exploit.
Approximately 80% of total cryptoasset losses originate from DeFi protocols. While formal verification and auditing can mitigate these losses, adoption remains mixed.
Vulnerabilities caused by unaudited code and logic flaws continue to exist, hitting small DEXs the hardest.
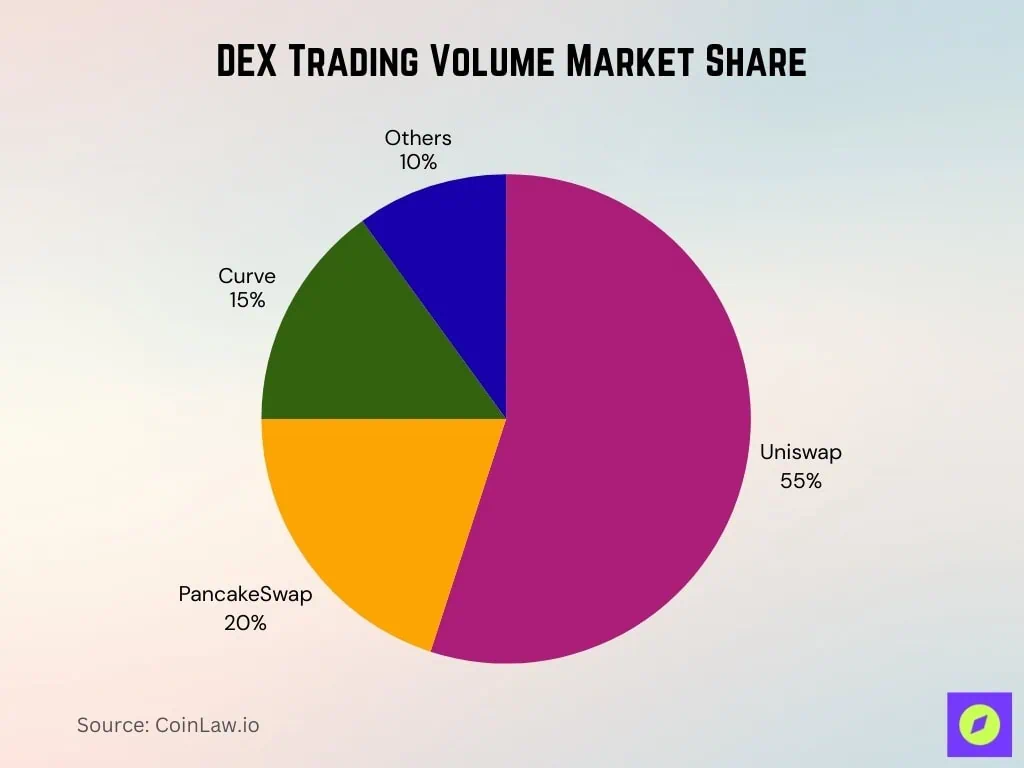
12. Trading volume market share
→ Uniswap dominates the DEX market with a 55% share and is the absolute leader in trading volume.
→PancakeSwap accounts for 20%, firmly ranking second among decentralized exchanges.
→Curve accounts for 15%, performing strongly in liquidity provision and stablecoin swaps.
→ Other DEXs together account for 10%, constituting a smaller but still competitive market segment.
13. Regulatory and Compliance Data
The United States passed the GENIUS Act in July 2025 to establish a regulatory framework for stablecoin issuers.
By 2025, 90% of centralized crypto exchanges in North America will be fully compliant with KYC requirements. The average compliance cost for crypto companies will increase by approximately 28% to $620,000 per year in 2025. Anti-money laundering (AML) and KYC protocols currently consume approximately 34% of compliance budgets.
The U.S. Commodity Futures Trading Commission (CFTC) enforcement actions increased by approximately 59% year-over-year.
14. Growth of DEX derivatives and perpetual contracts
In the second quarter of 2025, the trading volume of DEX perpetual futures reached US$898 billion.
Hyperliquid recorded $653 billion in trading volume in the second quarter, accounting for approximately 73% of the market share. dYdX remains one of the top decentralized derivatives exchanges.
- The growth is driven by demand for leverage, speculation and hedging tools.
- Institutional traders are increasingly participating in the perpetual contract market.
- Risk and compliance concerns remain major obstacles.
- Cross-chain perpetual contract products are emerging, bringing with them both opportunities and risks.
- For several quarters, the growth rate of derivatives trading volume has exceeded that of spot DEX.
15. DEX User Demographics and Geographic Distribution
By mid-2025, over 9.7 million unique wallets will interact with DEXs, up from approximately 6.8 million last year.
Daily trading volume is concentrated in North America, Europe, and Asia. Among these, DEX adoption is growing faster in developing countries. Institutional users are concentrated in jurisdictions with clearer regulations. Gender distribution still skews male, but with a slight shift.
Small transactions in Asia and Africa have higher adoption rates on low-fee chains.
16. Conclusion
The DEX field shows obvious signs of maturity.
Aggregators are not only tools for retail users but are increasingly becoming critical infrastructure for institutions. However, risks remain high, with vulnerability exploits, security lapses, and regulatory uncertainty posing a real threat.
DEX derivatives and perpetual contract trading has exploded, mobile and wallet-based platforms have become more attractive, and global user adoption continues to grow.
The key takeaways for traders and protocol developers are:
- Choose a DEX or aggregator that has undergone rigorous security audits
- Prioritize chains and tools that reduce fees and slippage
As DEXs increasingly approach centralized alternatives in terms of trading volume, liquidity depth, and trust, the next few years will test which platforms can withstand the challenges of security, compliance, and usability.


You May Also Like

Iran threatens US tech firms, raising stakes in military escalation

What Do the Latest On-Chain Data for Bitcoin (BTC) Show? Bullish or Bearish?


