

Solana Price Slips 9% as Retail Demand Wobbles and Bearish Sentiment Tightens

Highlights:
- The Solana price is down 9% to $140, as the crypto market wobbles.
- The US Spot ETF records the lowest inflow, indicating waning institutional demand.
- The technical outlook signals oversold conditions, as crypto analysts predict a further drop.
The Solana price has plummeted 9% over the past 24 hours to $140, as the crypto market wobbles. Notably, the Solana spot Exchange Traded Funds (ETFs) in the US have registered the lowest net inflows, indicating a weaker institutional demand. Moreover, the mood in the derivatives market shows a greater market correction, and this means there is less risk exposure to Solana.
According to the Sosovalue data, the US Solana spot ETFs recorded a net inflow of $1.49 million on Thursday. Most of this occurred through the Bitwise Solana staking ETF. This is the lowest inflow since the introduction of Solana ETFs and a sign of less demand among institutional investors and restricted risk exposure to market changes.
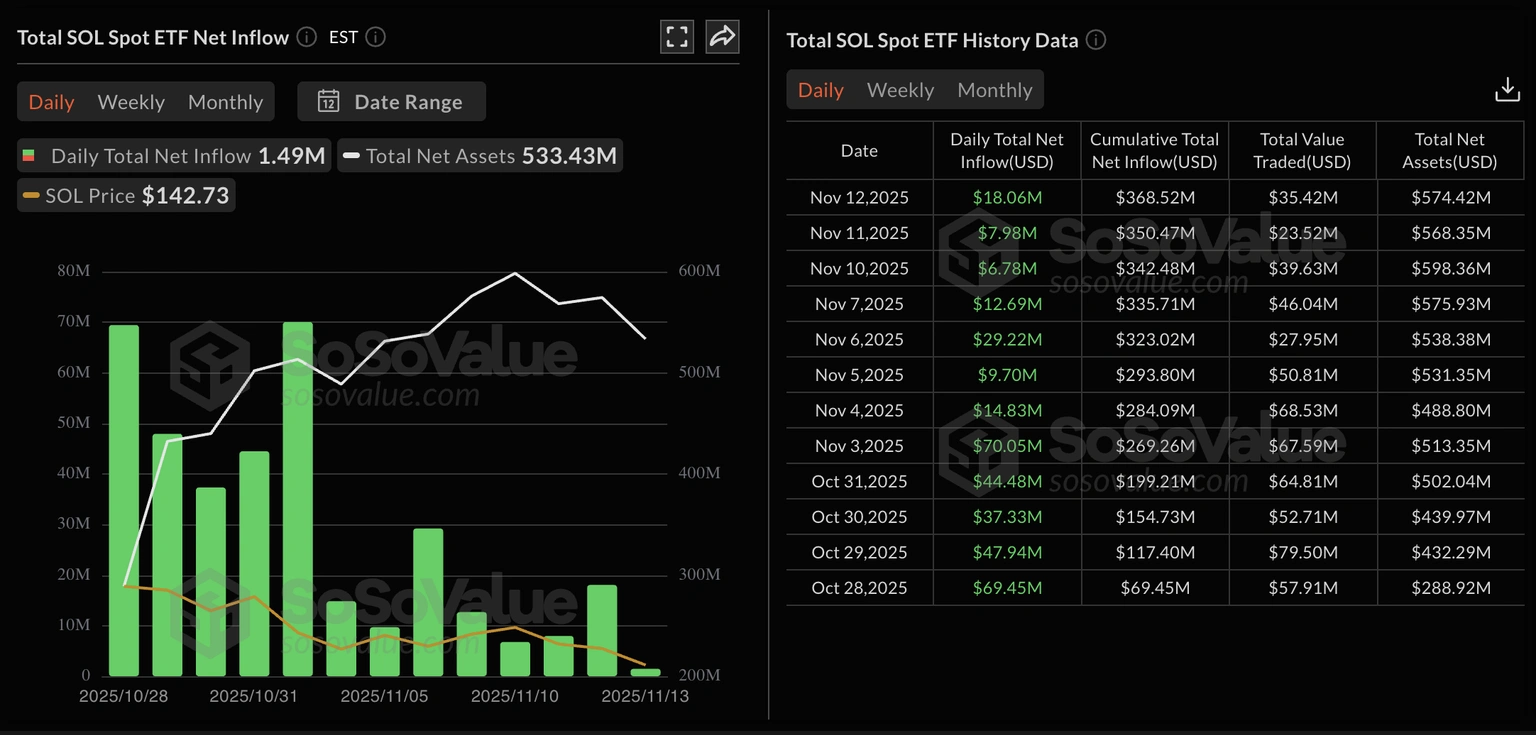 Total SOL Spot ETF: SoSoValue
According to CoinGlass data, SOL futures Open interest (OI), the notional value of SOL futures contracts with outstanding contracts, has decreased by 9.06% in the past 24 hours to reach $6.99 billion. This shows that traders are either buying out of long positions or are lowering leverage in the Solana price.
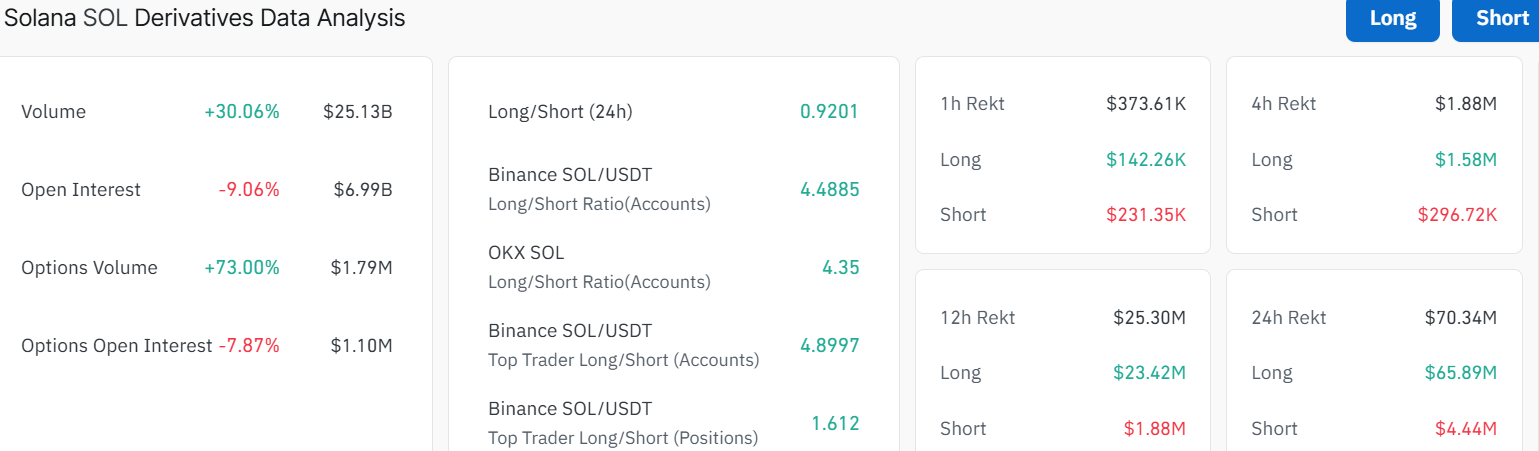 Solana Derivatives Coinglass
To support the bearish turn, the OI-weighted funding rate has moved to a negative position of -0.0105%. This suggests that traders are ready to hold short positions and expect a prolonged correction.
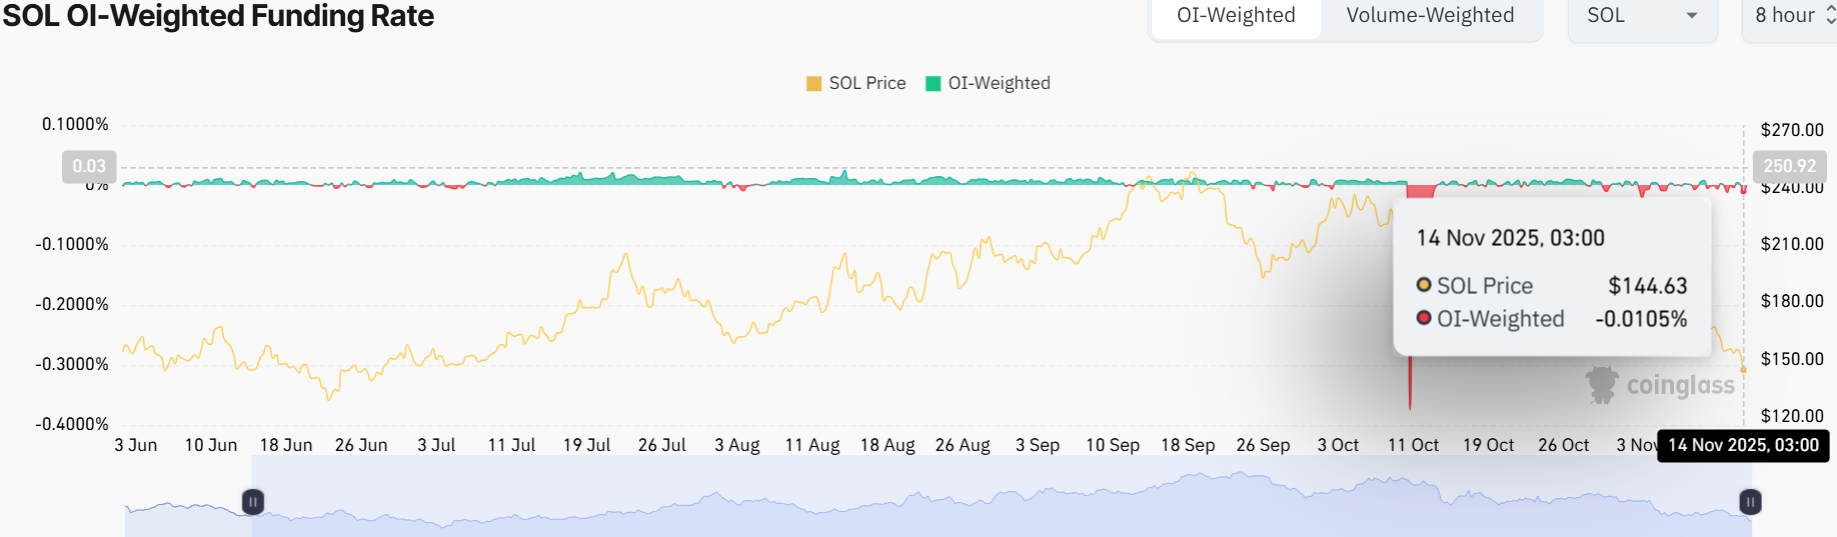 SOL OI-Weighted Funding Rate: CoinGlass
Solana Price Could Drop Further as Bearish Sentiment Persists
The SOL/USDT chart paints a brutal picture as the altcoin was cruising steadily around the $155 mark until a massive red candlestick hit. Currently, the price sits at $141, with the bears having the upper hand.
Some call the whole incident just market manipulation. Nevertheless, the 42% volume spike during the crash backs the idea of some shady moves. With the crypto market still swimming in the red and major altcoins dumping, many traders are sidelined to see what’s next for the Solana price.
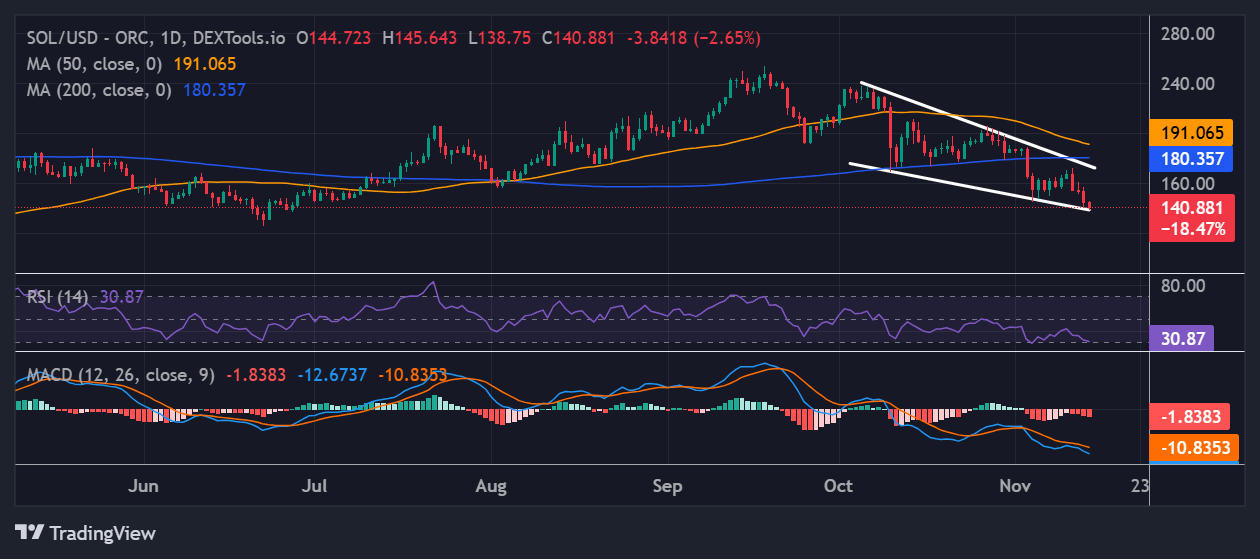 SOL/USD 1-day chart: TradingView
The Relative Strength Index (RSI) at 30.87 is in oversold territory, suggesting a potential bounce if bulls step up. Meanwhile, the Moving Average Convergence Divergence (MACD) shows a bearish crossover. This means that the bears may continue dominating, potentially causing a further drop in Solana price.
Traders can expect support around $124 or even lower if bears keep exerting pressure. Meanwhile, according to Ali Martinez, the on-chain data shows that below the $144 support for Solana price, there is barely any demand until $24.
On the flip side, $166 may offer a psychological resistance level, and breaking that could signal a weak recovery. Long-term, it’s a coin toss. If the project’s team drops some positive updates, the Solana price might claw back to $180 resistance by the end of November. Investors should let the dust settle first before making any moves and dip a toe in if the RSI climbs past 40. For now, it’s a wait-and-see game.
eToro Platform
Best Crypto Exchange
- Over 90 top cryptos to trade
- Regulated by top-tier entities
- User-friendly trading app
- 30+ million users
eToro is a multi-asset investment platform. The value of your investments may go up or down. Your capital is at risk. Don’t invest unless you’re prepared to lose all the money you invest. This is a high-risk investment, and you should not expect to be protected if something goes wrong.


You May Also Like

Troubling signs in new Trump intel report alarm expert: 'Raises real questions'

Top Analyst Uses Hydraulic Pipe Analogy to Project XRP Rally from Bitcoin Capital Rotation


