Hyperliquid is testing the crucial $50 support level, with participants eyeing whether bulls can hold the line or if deeper downside risks emerge.Hyperliquid is testing the crucial $50 support level, with participants eyeing whether bulls can hold the line or if deeper downside risks emerge.

Hyperliquid (HYPE) Price Prediction: Can Bulls Defend $50 or Will Sellers Push Towards $42?

Hyperliquid (HYPE) Price Prediction: $80 Wick Fill in Sight if Key Support Triggers Breakout

Hyperliquid has returned to a decisive price zone, and participants are closely watching to see whether the $50 handle will hold. After weeks of strength, the pullback has introduced a different tone to HYPE’s chart. Momentum has cooled, and sellers have forced price into critical support where bulls now face their biggest challenge yet.

Hyperliquid Breaks Structure as Bears Take Control

HYPE has slipped into a weaker setup after breaking its recent structure, with the chart showing a clean drop below the support base. The move has opened the door for a bearish retracement, where price could bounce back into the 0.5–0.618 Fibonacci levels around $52 to $54 before facing renewed selling pressure. As long as this zone caps upside attempts, the risk of another leg lower stays in play.

Hyperliquid Breaks Structure as Bears Take Control

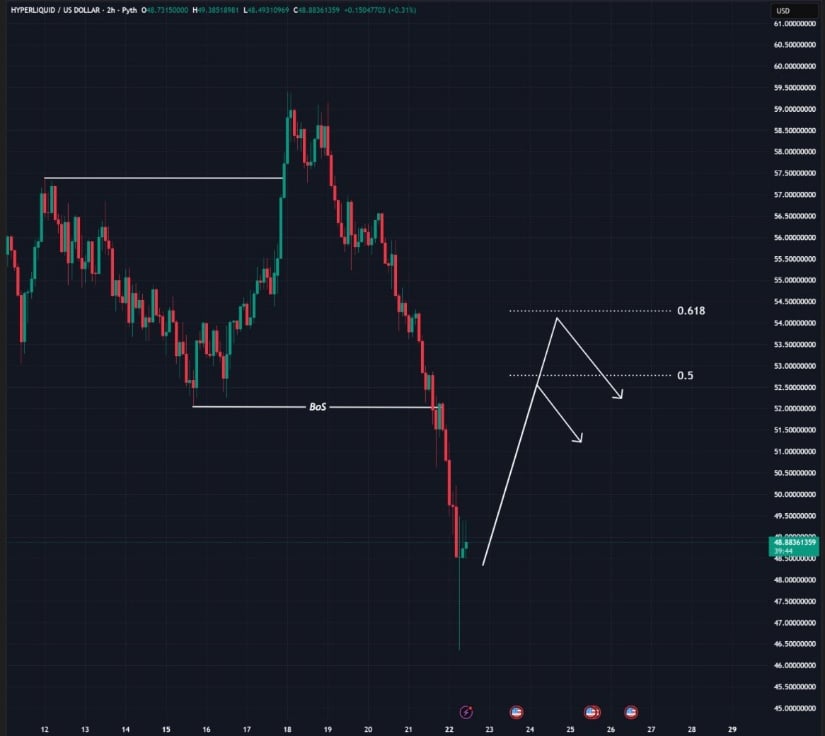
Hyperliquid slips below key support, with sellers pressuring HYPE towards deeper retracement levels. Source: Crypto Chiefs via X

Crypto Chiefs’ analysis leans toward further downside. For bulls, defending the $50 level will be key to avoid deeper trouble, but the structure right now gives the edge to sellers. If momentum continues this way, HYPE could retest its recent lows before any real recovery attempt begins.

Bollinger Bands Holding Critical Support Area

HYPE’s daily chart shows price dropping right into the lower Bollinger Band. The pullback has been steep, with nearly 5% lost on the day, but the alignment of the Bands suggests the market is reaching a point where selling pressure may start to ease. Volume on the decline is notable, which makes this test all the more important for bulls to hold.

Bollinger Bands Holding Critical Support Area

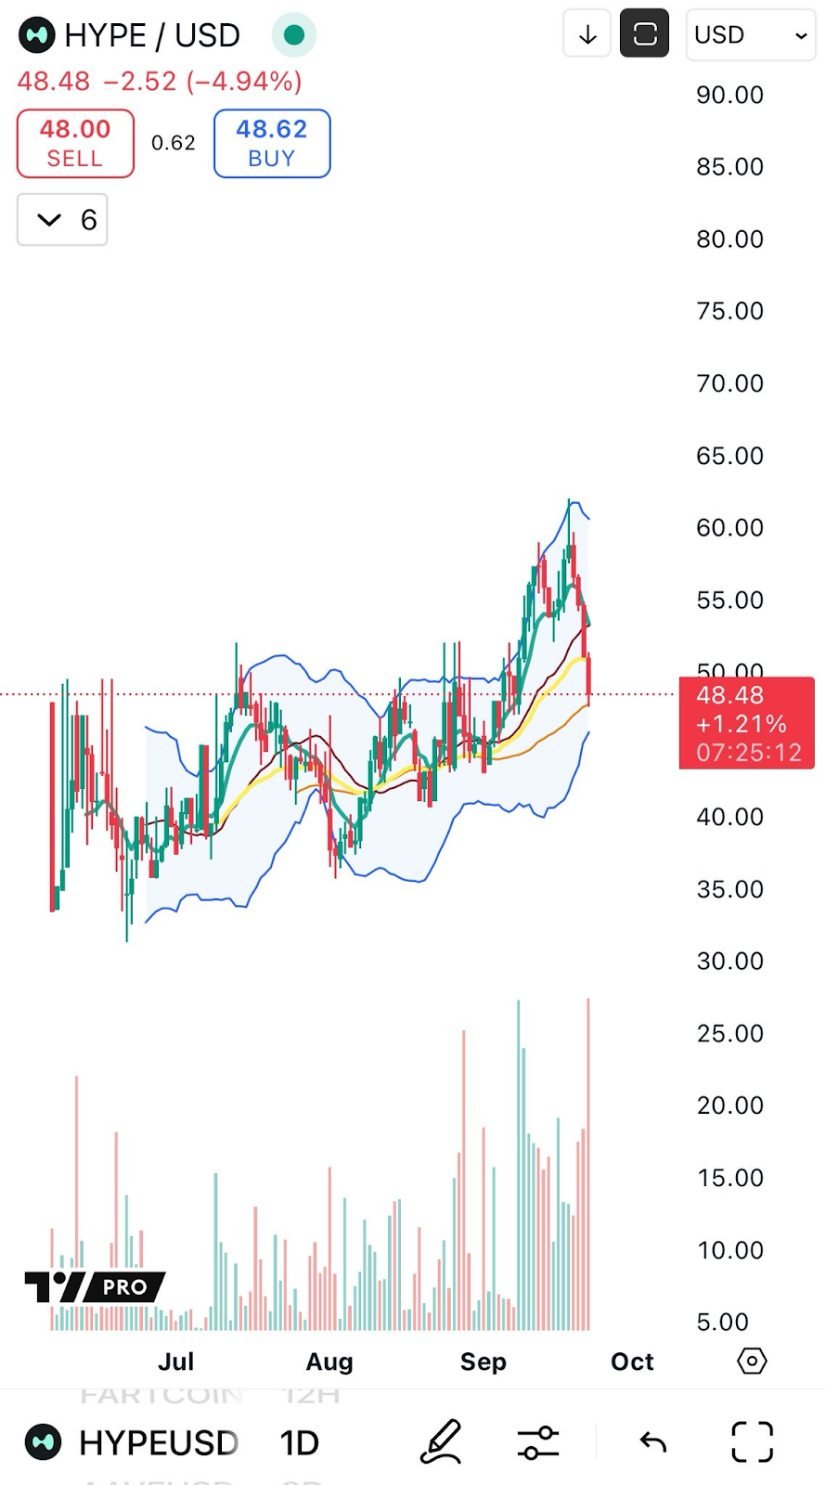
HYPE tests its lower Bollinger Band as bulls look to defend the $48–$49 support zone. Source: Big Cheds via X

Analyst Big Cheds highlights that holding the $48 to $49 range will be crucial, as a clean defense here could keep the broader uptrend intact and provide room for recovery.

Hyperliquid Price Prediction

HYPE is now hovering around a key make-or-break zone, with the chart showing a possible PO3 setup forming after an initial run into manipulation territory. The structure highlights how price has fallen back towards the $49 to $50 region. If this breakdown sustains, the consolidation could serve as a base for another leg lower.

Hyperliquid Price Prediction

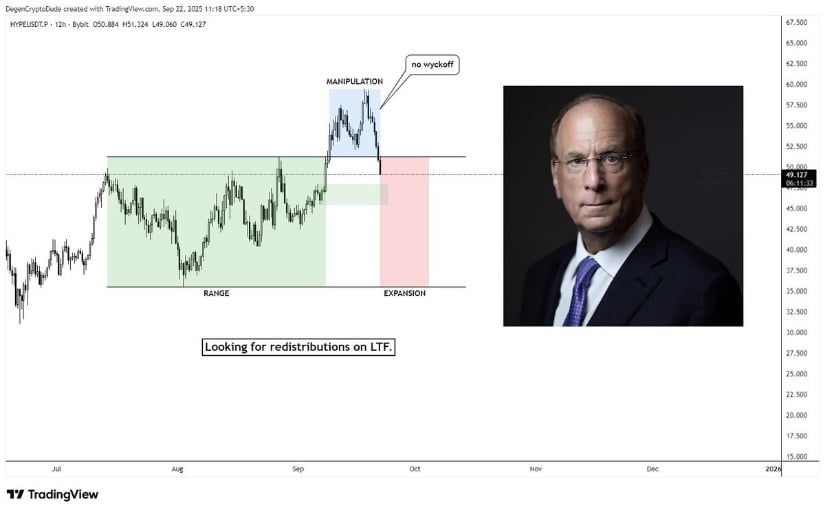
Hyperliquid hovers at the $49–$50 zone, with analyst warning of a redistribution setup that could expose $42 and $38 if support fails. Source: Khan via X

Analyst Khan points out that this setup is less of a textbook Wyckoff and more aligned with redistribution mechanics, where sellers could regain control if bulls fail to defend the level. For now, all eyes are on whether HYPE can stabilize around $49 and push back above $52; otherwise, a sustained breakdown could put $42 and even $38 into play as the next important zones.

Can Bulls Negate Emerging Pressure?

Hyperliquid is trading at $50.44 after a sharp -6.46% dip in the last 24 hours, putting it right back at the critical $50 zone. The daily chart reflects how momentum has cooled, with sellers forcing a retest of lower levels after the recent run. Despite the pullback, liquidity and volume remain stron, over $569M traded in the past day, showing that market participants are still actively positioning around this range.

Can Bulls Negate Emerging Pressure?

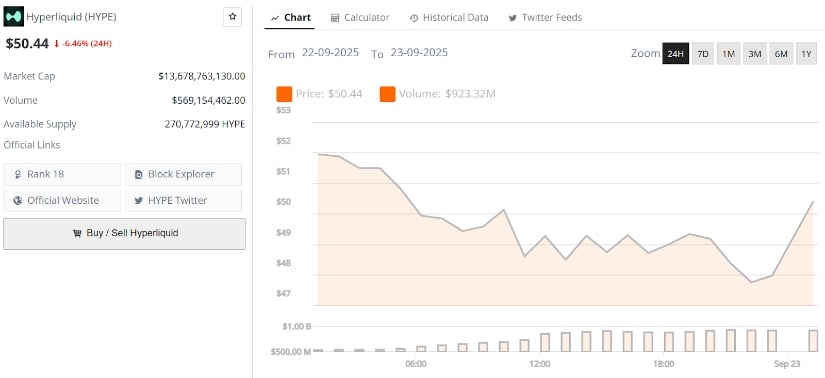
Hyperliquid’s current price is $50.44, down -6.46% in the last 24 hours. Source: Brave New Coin

The challenge for bulls now lies in countering ASTER’s growing traction, which has diverted attention and capital. If HYPE can defend the $49 to $50 base and reclaim $52 quickly, it may neutralize the short-term pressure and reestablish a path towards higher levels. Failure to hold here, however, would likely see sentiment weaken further, exposing $45 as the next major support.

Market Opportunity
Hyperliquid Logo
Hyperliquid Price(HYPE)
$24.47
$24.47$24.47
-0.85%
USD
Hyperliquid (HYPE) Live Price Chart
Disclaimer: The articles reposted on this site are sourced from public platforms and are provided for informational purposes only. They do not necessarily reflect the views of MEXC. All rights remain with the original authors. If you believe any content infringes on third-party rights, please contact service@support.mexc.com for removal. MEXC makes no guarantees regarding the accuracy, completeness, or timeliness of the content and is not responsible for any actions taken based on the information provided. The content does not constitute financial, legal, or other professional advice, nor should it be considered a recommendation or endorsement by MEXC.

You May Also Like

Microsoft Corp. $MSFT blue box area offers a buying opportunity

Microsoft Corp. $MSFT blue box area offers a buying opportunity

The post Microsoft Corp. $MSFT blue box area offers a buying opportunity appeared on BitcoinEthereumNews.com. In today’s article, we’ll examine the recent performance of Microsoft Corp. ($MSFT) through the lens of Elliott Wave Theory. We’ll review how the rally from the April 07, 2025 low unfolded as a 5-wave impulse followed by a 3-swing correction (ABC) and discuss our forecast for the next move. Let’s dive into the structure and expectations for this stock. Five wave impulse structure + ABC + WXY correction $MSFT 8H Elliott Wave chart 9.04.2025 In the 8-hour Elliott Wave count from Sep 04, 2025, we saw that $MSFT completed a 5-wave impulsive cycle at red III. As expected, this initial wave prompted a pullback. We anticipated this pullback to unfold in 3 swings and find buyers in the equal legs area between $497.02 and $471.06 This setup aligns with a typical Elliott Wave correction pattern (ABC), in which the market pauses briefly before resuming its primary trend. $MSFT 8H Elliott Wave chart 7.14.2025 The update, 10 days later, shows the stock finding support from the equal legs area as predicted allowing traders to get risk free. The stock is expected to bounce towards 525 – 532 before deciding if the bounce is a connector or the next leg higher. A break into new ATHs will confirm the latter and can see it trade higher towards 570 – 593 area. Until then, traders should get risk free and protect their capital in case of a WXY double correction. Conclusion In conclusion, our Elliott Wave analysis of Microsoft Corp. ($MSFT) suggested that it remains supported against April 07, 2025 lows and bounce from the blue box area. In the meantime, keep an eye out for any corrective pullbacks that may offer entry opportunities. By applying Elliott Wave Theory, traders can better anticipate the structure of upcoming moves and enhance risk management in volatile markets. Source: https://www.fxstreet.com/news/microsoft-corp-msft-blue-box-area-offers-a-buying-opportunity-202509171323
Share
BitcoinEthereumNews2025/09/18 03:50
DOGE ETF Hype Fades as Whales Sell and Traders Await Decline

DOGE ETF Hype Fades as Whales Sell and Traders Await Decline

The post DOGE ETF Hype Fades as Whales Sell and Traders Await Decline appeared on BitcoinEthereumNews.com. Leading meme coin Dogecoin (DOGE) has struggled to gain momentum despite excitement surrounding the anticipated launch of a US-listed Dogecoin ETF this week. On-chain data reveals a decline in whale participation and a general uptick in coin selloffs across exchanges, hinting at the possibility of a deeper price pullback in the coming days. Sponsored Sponsored DOGE Faces Decline as Whales Hold Back, Traders Sell The market is anticipating the launch of Rex-Osprey’s Dogecoin ETF (DOJE) tomorrow, which is expected to give traditional investors direct exposure to Dogecoin’s price movements.  However, DOGE’s price performance has remained muted ahead of the milestone, signaling a lack of enthusiasm from traders. According to on-chain analytics platform Nansen, whale accumulation has slowed notably over the past week. Large investors, with wallets containing DOGE coins worth more than $1 million, appear unconvinced by the ETF narrative and have reduced their holdings by over 4% in the past week.  For token TA and market updates: Want more token insights like this? Sign up for Editor Harsh Notariya’s Daily Crypto Newsletter here. Dogecoin Whale Activity. Source: Nansen When large holders reduce their accumulation, it signals a bearish shift in market sentiment. This reduced DOGE demand from significant players can lead to decreased buying pressure, potentially resulting in price stagnation or declines in the near term. Sponsored Sponsored Furthermore, DOGE’s exchange reserve has risen steadily in the past week, suggesting that more traders are transferring DOGE to exchanges with the intent to sell. As of this writing, the altcoin’s exchange balance sits at 28 billion DOGE, climbing by 12% in the past seven days. DOGE Balance on Exchanges. Source: Glassnode A rising exchange balance indicates that holders are moving their assets to trading platforms to sell rather than to hold. This influx of coins onto exchanges increases the available supply in…
Share
BitcoinEthereumNews2025/09/18 05:07
The Digital WOW Explains How AI Is Affecting Digital Marketing

The Digital WOW Explains How AI Is Affecting Digital Marketing

WEST PALM BEACH, Fla., Dec. 19, 2025 /PRNewswire/ — The Digital WOW, powered by ConsultPR.net, announces new findings on how AI is affecting digital marketing.
Share
AI Journal2025/12/19 17:30