

ETH Peaks at $2,400 Then Retreats to $2,241 — Bulls Fight to Hold Key Support
April 2026 will be remembered as the month Ethereum showed its hand — and then pulled it back. ETH entered the month near $2,034, staged an impressive recovery that touched the $2,400 resistance zone by mid-April, and then methodically gave back gains to land at $2,241 as the month closes. The price trajectory forms a textbook advance-and-fade pattern — not a collapse, but a measured retreat that has placed bulls and bears in direct confrontation at a critical technical crossroads. What happens at $2,241 may define Ethereum’s direction for the entire second quarter.
Monthly Price Action: Reading the April 2026 Chart
The April chart narrates the story with precision. ETH opened the month near $2,034 — itself a historically significant level that represented the multi-month base built during Q1 2026’s brutal correction from late 2025 highs near $3,769. From that base, buyers took control decisively in the first two weeks.
ETH has been range-bound between roughly $2,100 and $2,400 for the past six weeks, with brief recovery attempts capped well below key moving averages as bears remain structurally in control.
The mid-April surge to $2,400 was the month’s defining moment — a clean test of the resistance zone that has capped every meaningful rally since early 2026. The rejection at that level was equally clean. ETH attempted another move toward the $2,350–$2,400 zone but faced rejection again and is now consolidating just below it, clearly showing that while buyers are active, sellers are still aggressively defending higher levels.
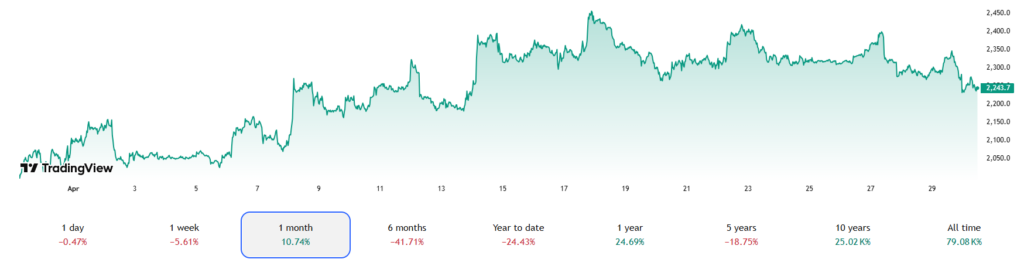 Source: TradingView
The current price of $2,241 sits in a technically sensitive no-man’s-land — above the April open, below the April high, and approaching a cluster of support levels that will determine whether this month’s recovery holds any lasting structural value.
Technical Indicators: Between Bullish Hope and Bearish Reality
The oscillator picture is mixed but telling. As of late April 2026, ETH’s RSI reads near 45 with a bearish MACD crossover forming, while the Crypto Fear and Greed Index sits at 46 — Fear territory — with Bitcoin dominance elevated at 58.2%, signaling capital rotation away from altcoins and into BTC.
An RSI of 45 is not yet oversold, meaning there is room for further downside before the market reaches a statistically compelling buy zone. The bearish MACD crossover is the more urgent warning signal — it indicates that short-term momentum has flipped negative even as price remains above the monthly open.
The moving average picture adds another layer of pressure. The 10-day moving average sits far overhead at $2,661 and the EMA at $2,586, both pointing downward — a classic sign of a bearish trend still in force at the macro level. Until ETH reclaims these overhead averages, every rally is technically a counter-trend move until proven otherwise.
One silver lining: ETH has been forming a series of higher lows over the past two weeks — a positive structural sign showing gradual strength building — while the rising trendline support from the $1,800 bottom remains intact, preventing deeper drops.
Bearish Reasons: What Is Driving the Retreat
1. Geopolitical Risk-Off Pressure: ETH retreated between 2.41% and 2.76% on April 27 as the broader crypto complex absorbed risk-off pressure tied to stalled U.S.-Iran peace talks and Brent crude advancing to $108 per barrel. Ethereum has shown higher beta than Bitcoin during these risk-off pulses — falling harder and faster than BTC in the same macro environment.
2. Bitcoin Dominance Squeeze: Bitcoin dominance near 58.2% — close to multi-year highs — signals capital rotation from altcoins into BTC, with ETH’s 10.6% market dominance near historical lows relative to its long-run average. In an environment where BTC absorbs the majority of new institutional inflows, ETH is structurally disadvantaged in the short term.
3. $2,400 Supply Wall Holds Firm: The decisive battleground remains at $2,150 where technical support converges with significant liquidation vulnerability on daily timeframes, while Ethereum must recapture the $2,480 level before any bullish thesis gains substantial credibility.
Bullish Reasons: Why the Support Floor Is Real
Despite the retreat, the demand architecture beneath ETH remains genuinely impressive — and represents one of the clearest divergences between price and fundamentals seen all year.
1. BitMine Institutional Accumulation: BitMine Immersion Technologies crossed the 5 million ETH ownership threshold with its largest weekly purchase of 2026, adding 101,901 ETH over the past week and bringing total holdings to 5,078,386 ETH valued at approximately $11.75 billion. Institutional accumulation at this scale during a price pullback is a classic bullish absorption signal.
2. Developer Activity at Record Highs: The 180-day moving average of new smart contract deployments hit a record high, reinforcing network utility growth. Historically, spikes in smart contract activity have preceded price recoveries with a lag of three to six months — putting the current developer-activity strength on track to feed into price action through Q3 2026.
3. Glamsterdam Upgrade Catalyst: Ethereum’s ecosystem continues to expand following the “Glamsterdam” upgrade scheduled for the first half of 2026, and the reduction in exchange-held supply suggests that investors are moving ETH into hardware wallets for long-term storage, effectively reducing selling pressure.
4. Long/Short Positioning Skews Bullish: ETH shows 59.9% longs versus 40.1% shorts on Binance perpetuals — a starkly bullish-leaning positioning that contrasts sharply with BTC’s deeply bearish 37.1% long / 62.9% short split, suggesting ETH-specific confidence from derivatives traders despite the price weakness.
Key Levels: The Battlefield for May
| Level | Role | Signal |
|---|---|---|
| $2,400 | Primary Resistance | 🔴 Triple Rejection Zone |
| $2,350 | Secondary Resistance | 🔴 Descending Resistance Cap |
| $2,241 | Current Price | 🟡 Critical Inflection |
| $2,200 | Key Support Floor | ✅ Must Hold |
| $2,169 | Major Demand Zone | ✅ Institutional Buy Area |
| $2,100 | Range Bottom Support | 🔴 Breakdown Trigger |
| $1,800 | Rising Trendline Base | ✅ Macro Bull Structure |
If Ethereum fails to clear the $2,400 resistance on its next attempt, a return to the $2,100 level to shake out late long positions is likely, while a clean break above $2,400 targets $2,650 in the bullish scenario.
May 2026 Outlook: The Decision Point
April ends with Ethereum at a genuine inflection point. ETH needs a strong breakout above $2,400 to confirm further upside; otherwise, it may continue to move sideways or pull back. The upward move is slow and lacks strong volume, reflecting weak conviction — ETH is in a transition phase, improving but still not fully bullish.
The macro catalyst that could break this stalemate is a shift in Bitcoin dominance. Most analysts cite a BTC dominance decline below 55–56% as the key prerequisite for a full alt-season, and ETH’s compressed 10.6% dominance creates conditions for a strong mean-reversion rally once BTC dominance peaks and reverses.
April’s journey — from $2,034 to $2,400 and back to $2,241 — is not a failure. It is a stress test. The bulls passed the first phase by recovering the monthly open. The second phase — holding $2,200 and breaking $2,400 — now begins.


You May Also Like

Telomir Pharmaceuticals Receives FDA Clearance for Phase 1/2 Trial of Telomir-Zn in Triple-Negative Breast Cancer
Cango Inc. Completes $65M Investment and Secures $10M Convertible Note Financing
