

Ethereum (ETH) Price: ETH Is at a Make-or-Break Zone — Here’s What the Charts Show
TLDR
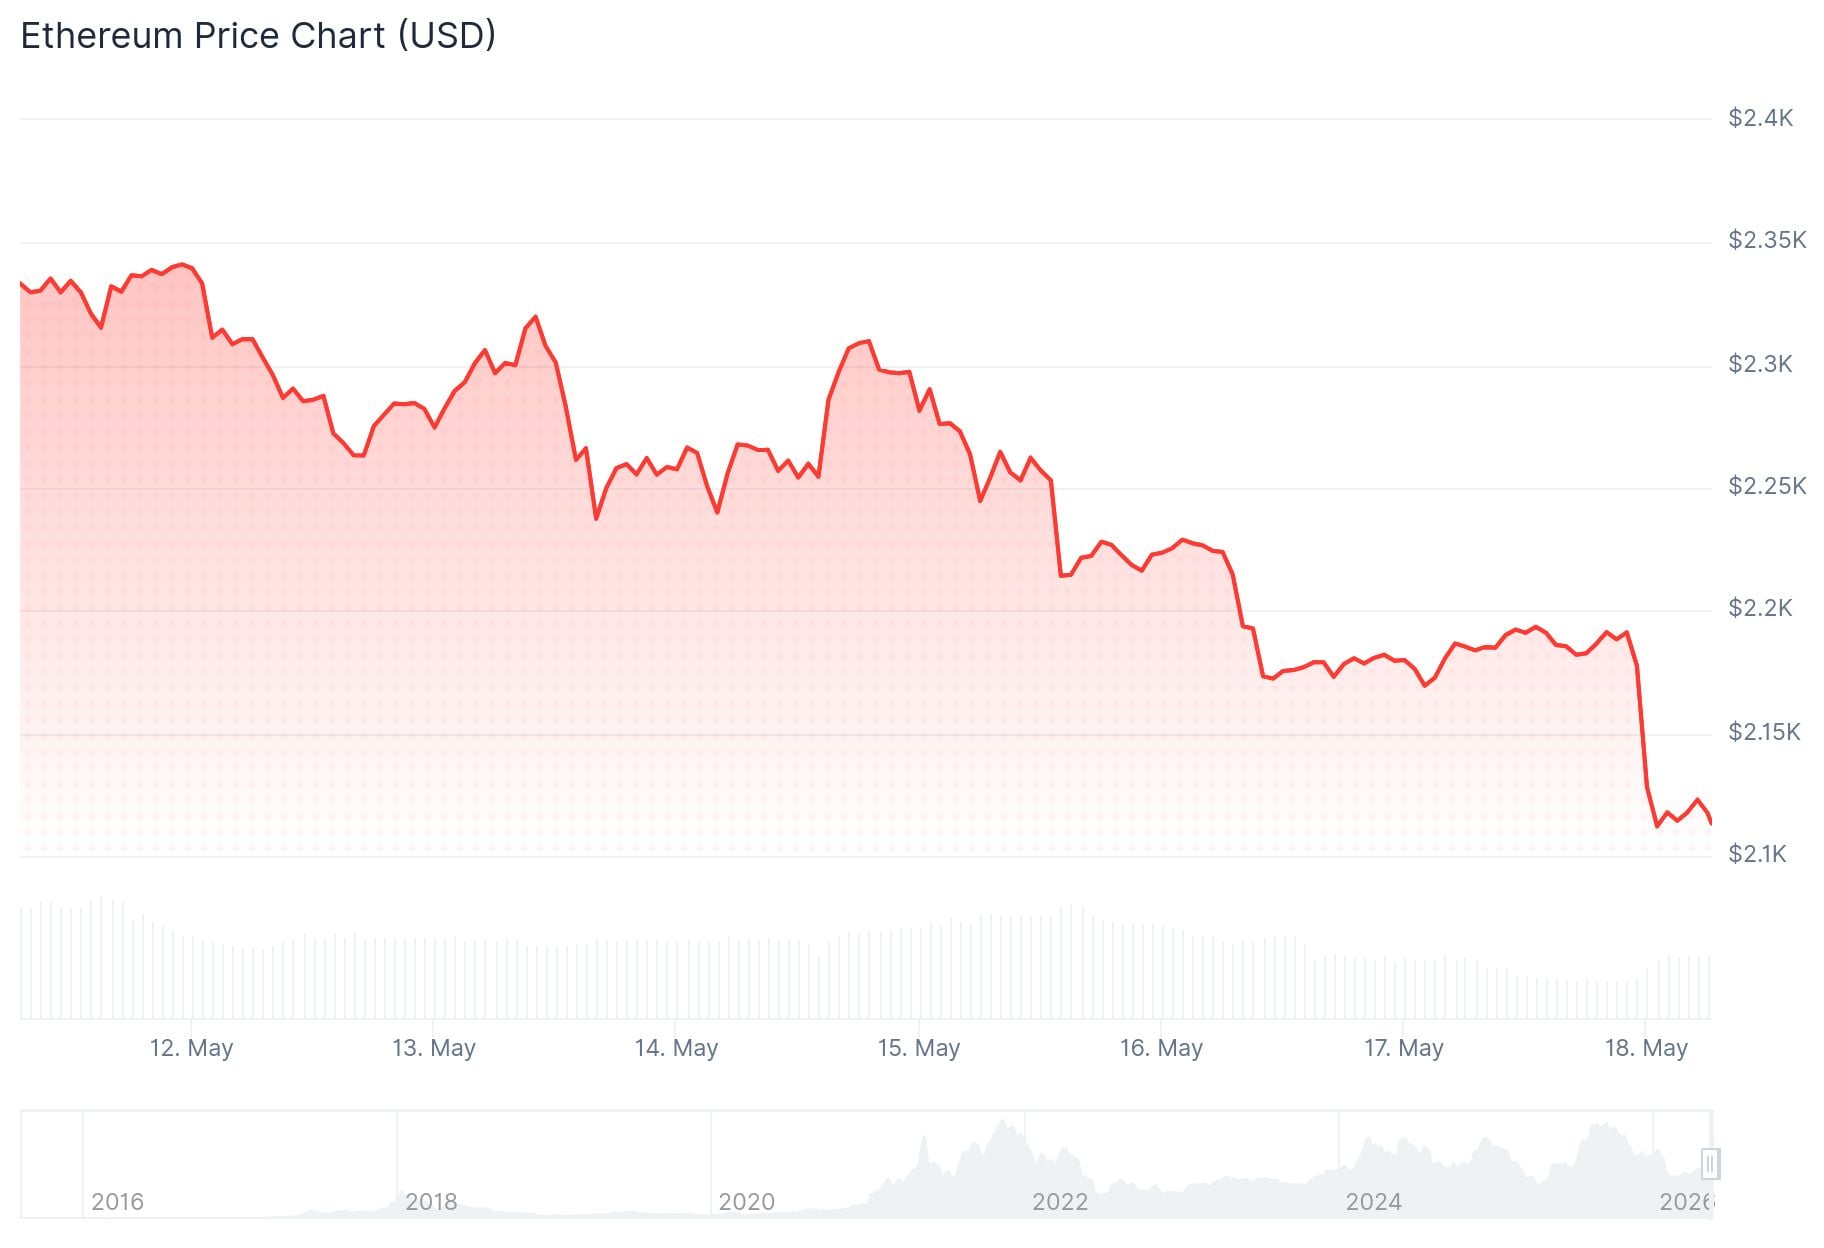
- ETH is trading near $2,184–$2,188, with key support at $2,170 and $2,122
- RSI at 39.57 and negative MACD signal weak buying pressure on the daily chart
- A CME gap near $2,680 remains an upside target; $11B in shorts could be liquidated if filled
- Corporate ETH reserves now hold 7.33 million ETH worth ~$16 billion, about 6% of total supply
- ETH needs to reclaim $2,300–$2,501 before the $2,680 target becomes realistic
Ethereum is trading near $2,185 as of May 18, 2026, sitting at a key decision point on the daily chart. Buyers are trying to hold the lower end of a trading channel, while technical indicators show pressure is building.
 Ethereum (ETH) Price
The RSI stands at 39.57, below the neutral 50 level, pointing to weak buying momentum. The MACD line is at -20.2, with the signal line at -15.8 and a negative histogram, showing bearish pressure has not cleared yet.
Analyst More Crypto Online noted that the drop does not look like a full sell-off or major market top. The analyst said the pullback still looks corrective as long as ETH holds the lower channel boundary.
Analyst Cryptorphic added that momentum has weakened after a rejection from the upper resistance range. A move below local support showed buyers were losing control in the short term.
Key Support and Resistance Levels
The nearest support sits at $2,170 and $2,122. If those levels fail, the $2,037 zone becomes the next major area to watch.
On the upside, ETH needs to break above $2,318 to improve its chart setup. After that, $2,501 is the main Fibonacci resistance, and a clean move above it would open the path toward $2,680.
Analyst Max Crypto pointed out that ETH still has an open CME gap near $2,680. CME gaps often attract price action when momentum returns. Max also noted that around $11 billion in shorts could be liquidated if ETH reaches that level, which could create faster upside movement.
Corporate ETH Reserves Hit $16 Billion
Analyst Crypto Patel shared CoinGlass data showing companies with strategic Ethereum reserves now hold 7.33 million ETH, worth nearly $16 billion. That represents roughly 6% of Ethereum’s total supply sitting on corporate balance sheets.
Patel highlighted the data as a sign of growing institutional accumulation. A larger share of ETH held in long-term reserves reduces the available circulating supply over time.
Analyst Ted Pillows noted that Ethereum tapped the $2,150 support zone as he had predicted, saying a bounce from that area was possible if the zone held.
One longer-term chart from analyst Sangita_Gems showed ETH inside a falling wedge formation that mirrors a previous recovery cycle. That setup projects a potential move toward $7,000 if ETH breaks out and retests the range successfully.
For now, ETH remains inside its channel with $2,100 as the lower trendline support and $2,501 as the upper resistance target.
The post Ethereum (ETH) Price: ETH Is at a Make-or-Break Zone — Here’s What the Charts Show appeared first on CoinCentral.


You May Also Like

PMI-ACP Exam Preparation: How to Use a Simulator and Practice Questions Effectively

OpenVPP accused of falsely advertising cooperation with the US government; SEC commissioner clarifies no involvement


