Bitcoin price today: BTC stalls under $77K after $80K rejection — 78.8K or 76.5K

As of 18 May 2026, risk stays tilted lower, with Bitcoin price today mirroring cautious flows after last week’s rejected 80k test, while intraday sellers cap bounces.
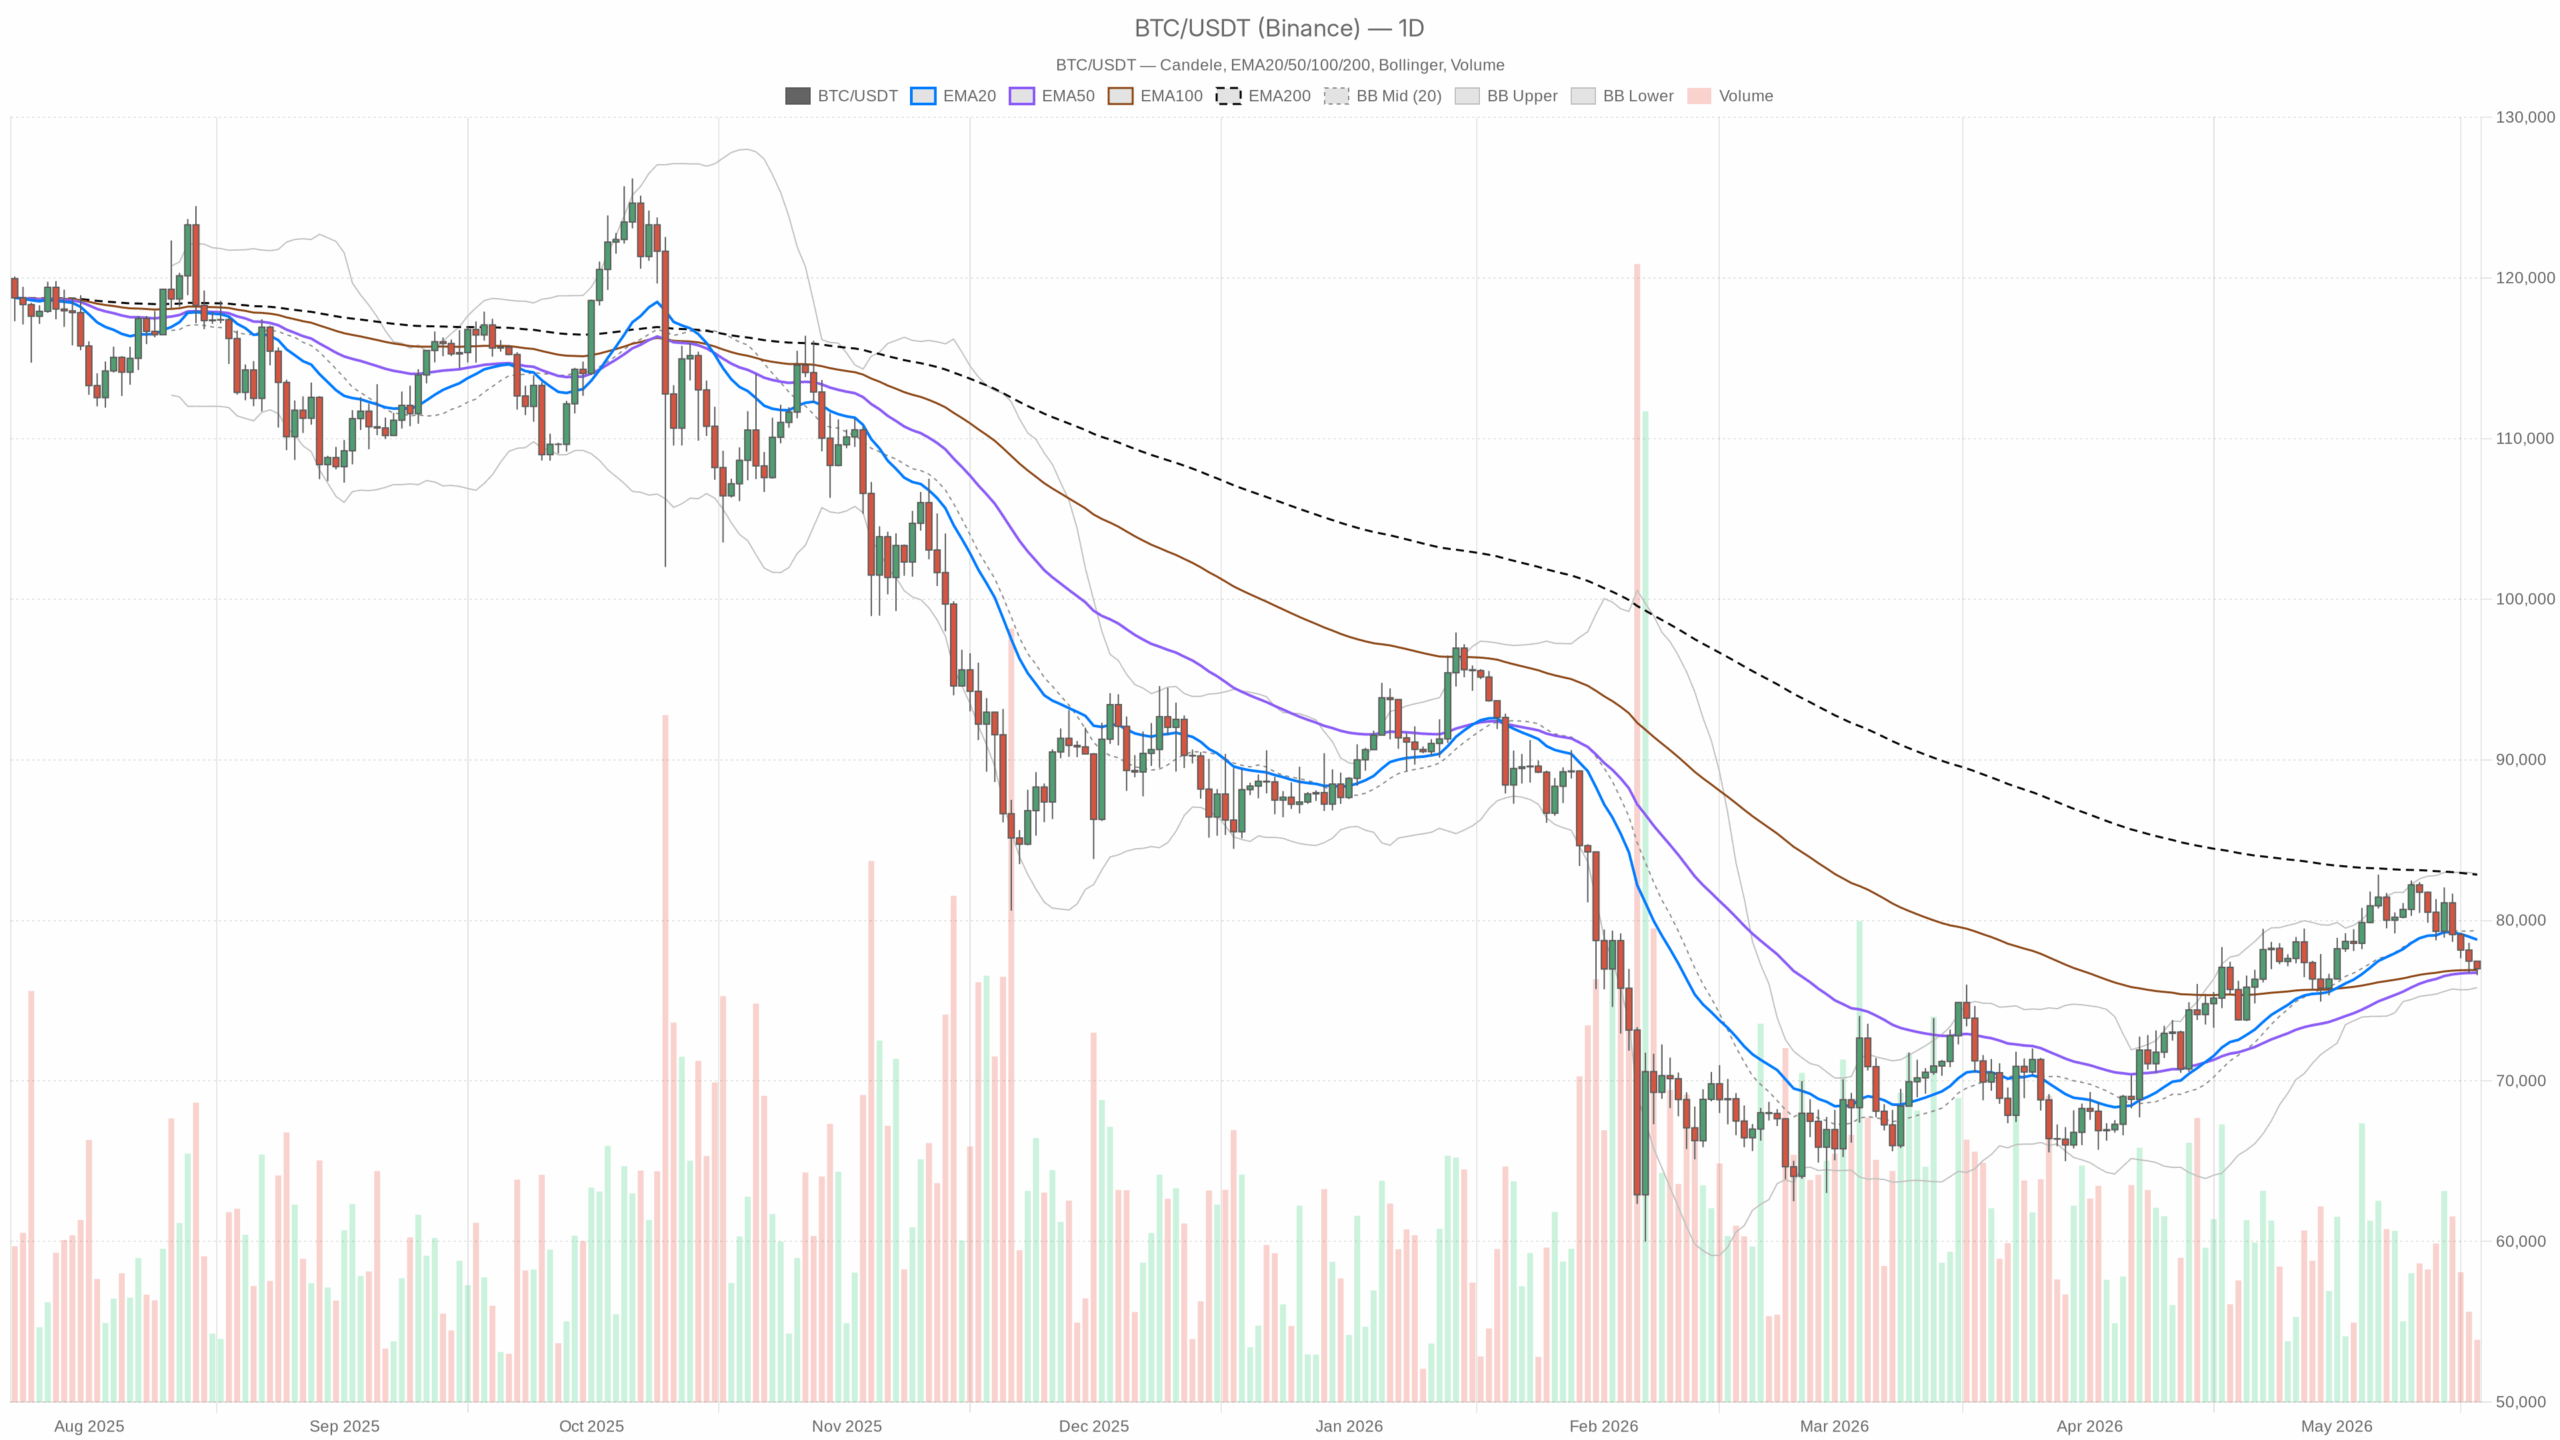 BTC/USDT — daily chart with candlesticks, EMA20/EMA50 and volume.
Market logic first
Bitcoin trades near 76,985 after last week’s run at 80k, slipping below near-term resistance and chopping in the lower half of its daily range. Meanwhile, risk-off positioning dominates. Total crypto market cap is down about 1.45% over 24h. The Fear & Greed Index is at 28, and dominance near 58.3% hints at capital hiding in Bitcoin while alt risk is being reduced.
However, the daily chart is neutral but leaning soft: still above the daily 50-EMA, yet capped below the 20-EMA and well under the 200-EMA. That is classic range behavior after a failed breakout. If bulls reclaim 78.8k, momentum can reset; if 76.5k gives way, the range likely resolves lower and volatility picks up.
Structure vs momentum: On the daily, price is ranging, with support around 75.8–76.5k and resistance near 79–80k. Momentum is subdued (RSI under 50, MACD negative), so rallies fade unless key averages are reclaimed. On the 1-hour, momentum stays negatively skewed. Reclaiming 78.8k could reset momentum; losing 76.5k would likely drive Bitcoin price today toward a lower-range resolution.
Moreover, risk appetite is constrained. A fearful tape with falling DeFi fee activity and a softer total market cap keeps buyers cautious. That does not guarantee downside continuation, but it limits follow-through on bounces until liquidity and sentiment improve.
Multi-timeframe read
Daily bias (macro): Neutral with a bearish tilt. Price is below the 20-EMA and the Bollinger midline, but still above the 50-EMA and above the lower band. That combination points to range-trading conditions where dip-buys work only if they reclaim overhead levels quickly.
1H confirmation (tactical): Bearish. Price sits beneath the 20/50/200 EMAs with RSI in the low 30s, showing intraday sellers still in control. Additionally, any bounce has work to do through layered resistance near 77.1k–77.6k before bulls can talk trend.
15m execution context: Stabilizing. MACD histogram has ticked positive and price is hovering around the 15m 20-EMA. However, it is fragile and can flip back if 76.9k breaks.
Indicator evidence with quick interpretations
Daily (D1)
- RSI(14): 45.06 — Momentum is below neutral; bounces lack strong follow-through unless levels are reclaimed.
- MACD: line 640.45 vs signal 1298.18, histogram -657.72 — Still in a downswing; bulls need a flattening and cross-up to regain initiative.
- EMAs: 20-EMA 78,792; 50-EMA 76,735; 200-EMA 82,839 — Price is under the 20-EMA but above the 50-EMA, a classic range look; the 200-EMA overhead keeps the bigger trend capped.
- Bollinger Bands: mid 79,364; upper 82,913; lower 75,814 — Trading in the lower half of the band, near a support pocket but with resistance overhead.
- ATR(14): 1,978 — Daily swings near $2k; expect sharp moves and stop sweeps around key levels.
- Pivots: PP 77,016; R1 77,448; S1 76,553 — Price is hovering around the pivot; today’s tone likely hinges on who wins the 77k tug-of-war.
Hourly (H1)
- RSI(14): 33.11 — Intraday momentum is weak; sellers control unless a bounce lifts RSI back toward 45–50.
- MACD: line -356.47 vs signal -299.07, histogram -57.39 — Bearish but not accelerating; room for a mean-reversion pop, not a trend change yet.
- EMAs: 20-EMA 77,462; 50-EMA 78,024; 200-EMA 79,447 — Price below all three; any rally faces stacked resistance into 77.5–78.0k.
- Bollinger Bands: mid 77,614; upper 78,790; lower 76,437 — Riding the lower band; first bounce target is the mid-band near 77.6k.
- ATR(14): 414 — Typical hourly range ~400; intraday levels can be tested quickly.
- Pivots: PP 77,044; R1 77,123; S1 76,907 — Micro-battlefield sits right at price; losing S1 exposes 76.44k, reclaiming R1 opens 77.6k.
15-minute (M15)
- RSI(14): 46.93 — Neutralizing from earlier weakness; not yet bullish.
- MACD: line -68.01 vs signal -111.81, histogram +43.79 — Early uptick in short-term momentum; constructive for a bounce attempt.
- EMAs: 20-EMA 77,001; 50-EMA 77,262; 200-EMA 78,039 — Price is trying to base around the 20-EMA; 77.26k is the first heavier cap.
- Bollinger Bands: mid 76,955; upper 77,130; lower 76,781 — Sitting near the midline; a push to the upper band would align with a test of the H1 pivot/R1 zone.
- ATR(14): 168 — Fast noise within a ~170 range; fades and squeezes can be abrupt.
- Pivots: PP 77,009; R1 77,051; S1 76,943 — Very tight intraday ladder; whipsaws likely around 77k.
Scenarios
Bullish path. Hold 76,90k–76,55k on dips, then reclaim 77,12k (H1 R1) and 77,45k (D1 R1). That likely squeezes price toward 77,60k–77,80k (H1 mid/20-EMA) and sets up a test of 78,80k (D1 20-EMA). Invalidation: An hourly close below 76,55k or a daily close back under the 50-EMA (~76,74k) undermines the bounce setup.
Bearish path. Fail to reclaim 77k and break through 76,55k (D1 S1), then pressure the lower Bollinger band near 75,81k. With daily ATR near $2k, a clean band break could extend toward the 75k round number and even 74k if momentum accelerates. Invalidation: A daily close above 78,80k (D1 20-EMA) or sustained trade above 77,60k on the 1H weakens the bear case and points back to range highs.
Positioning, risk, and uncertainty
Overall, this remains a range with a bearish lean on lower timeframes. The tape favors mean reversion into resistance rather than trending follow-through. Volatility is lively (D1 ATR ~$2k; H1 ATR ~$400), so levels can be run and reclaimed quickly. Therefore, plan for fakeouts around 77k, respect support down to 76.5k, and do not overstay moves into 77.6–78.0k unless the daily 20-EMA is retaken.
In sum, buyers need fast reclaim signals above resistance, while sellers rely on failed bounces and a 76.5k break to force range expansion. Until then, expect choppy rotations with headline-sensitive spikes.


You May Also Like

White House Announces Major U.S.–China Trade Deals
Goldman Sachs crypto ETF holdings drop XRP and Solana in Q1 2026 filing