

Bitcoin Crash Dominated By US Selling, CryptoQuant Data Shows
On-chain analytics firm CryptoQuant has revealed how selling from US Bitcoin investors has dominated during the recent market downturn.
Bitcoin Coinbase Premium Gap Points To US Selloff
In a new thread on X, CryptoQuant has talked about some key pieces of data related to the US-dominated Bitcoin selloff. The first indicator that CryptoQuant has shared is the “Coinbase Premium Gap,” which keeps track of the difference between the BTC price listed on Coinbase (USD pair) and that on Binance (USDT pair).
As the below chart shows, the 30-hour moving average (MA) value of this metric has plummeted into the red territory recently.
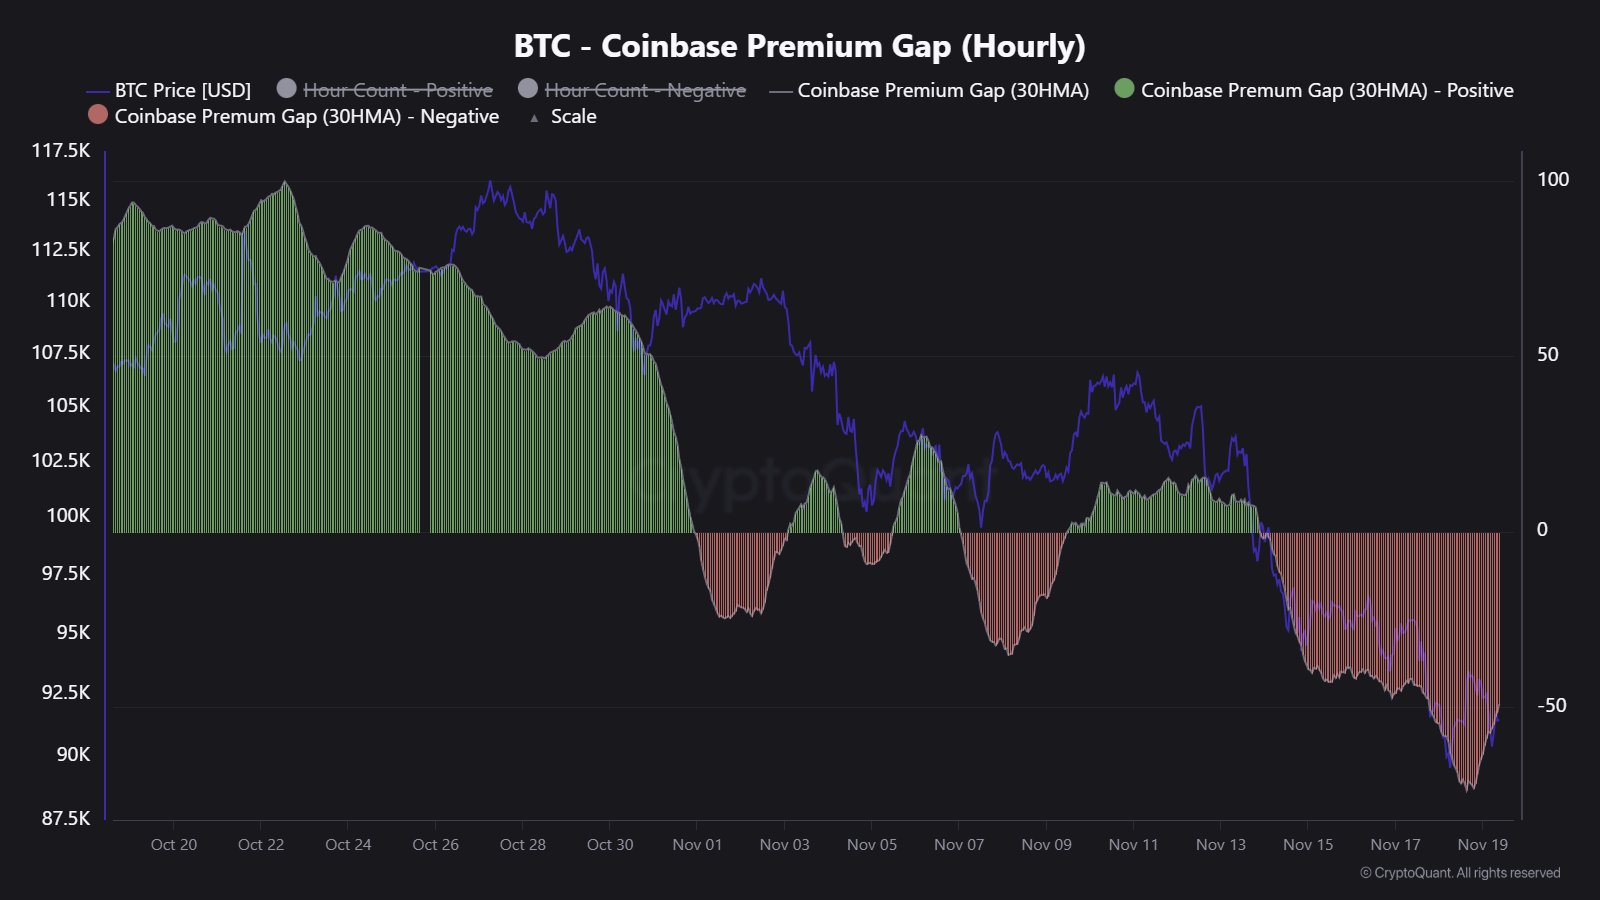
A negative value on the Coinbase Premium Gap indicates that the asset is trading at a price lower on Coinbase as compared to Binance. The former exchange is the preferred platform of the American investors, especially large institutional entities, while the latter one hosts a global traffic. As such, a red premium can be a sign that US-based whales are selling more than world investors.
“The Coinbase Premium Gap dropped as low as -$90, which is a sign of strong U.S. selling pressure,” explained the analytics firm. Another metric that points toward extraordinary selling pressure from the American traders during the recent price decline is the cumulative return for the different trading sessions.
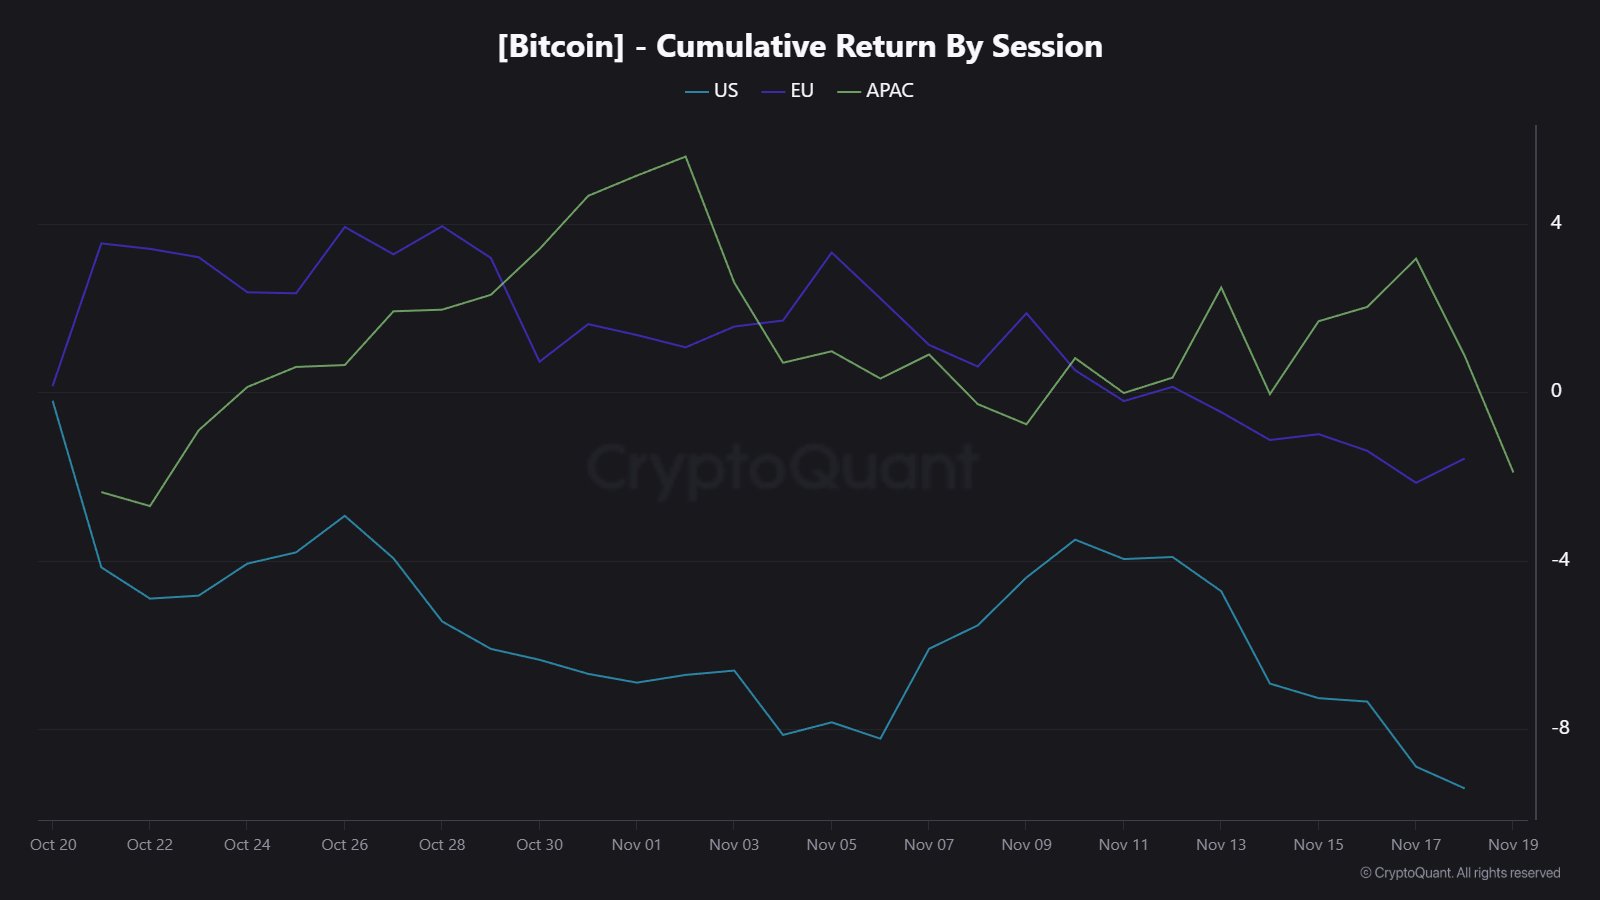
From the above chart, it’s visible that both European and Asia-Pacific trading hours have seen an almost neutral return in Bitcoin over the past month. The American session, on the other hand, has witnessed a deep negative value.
Another major way institutional entities invest in Bitcoin is through the spot exchange-traded funds (ETFs), investment vehicles that hold BTC on behalf of their investors, and allow them to gain off-chain exposure to the coin’s price movements.
These funds have also witnessed outflows during the selloff in the last few weeks.
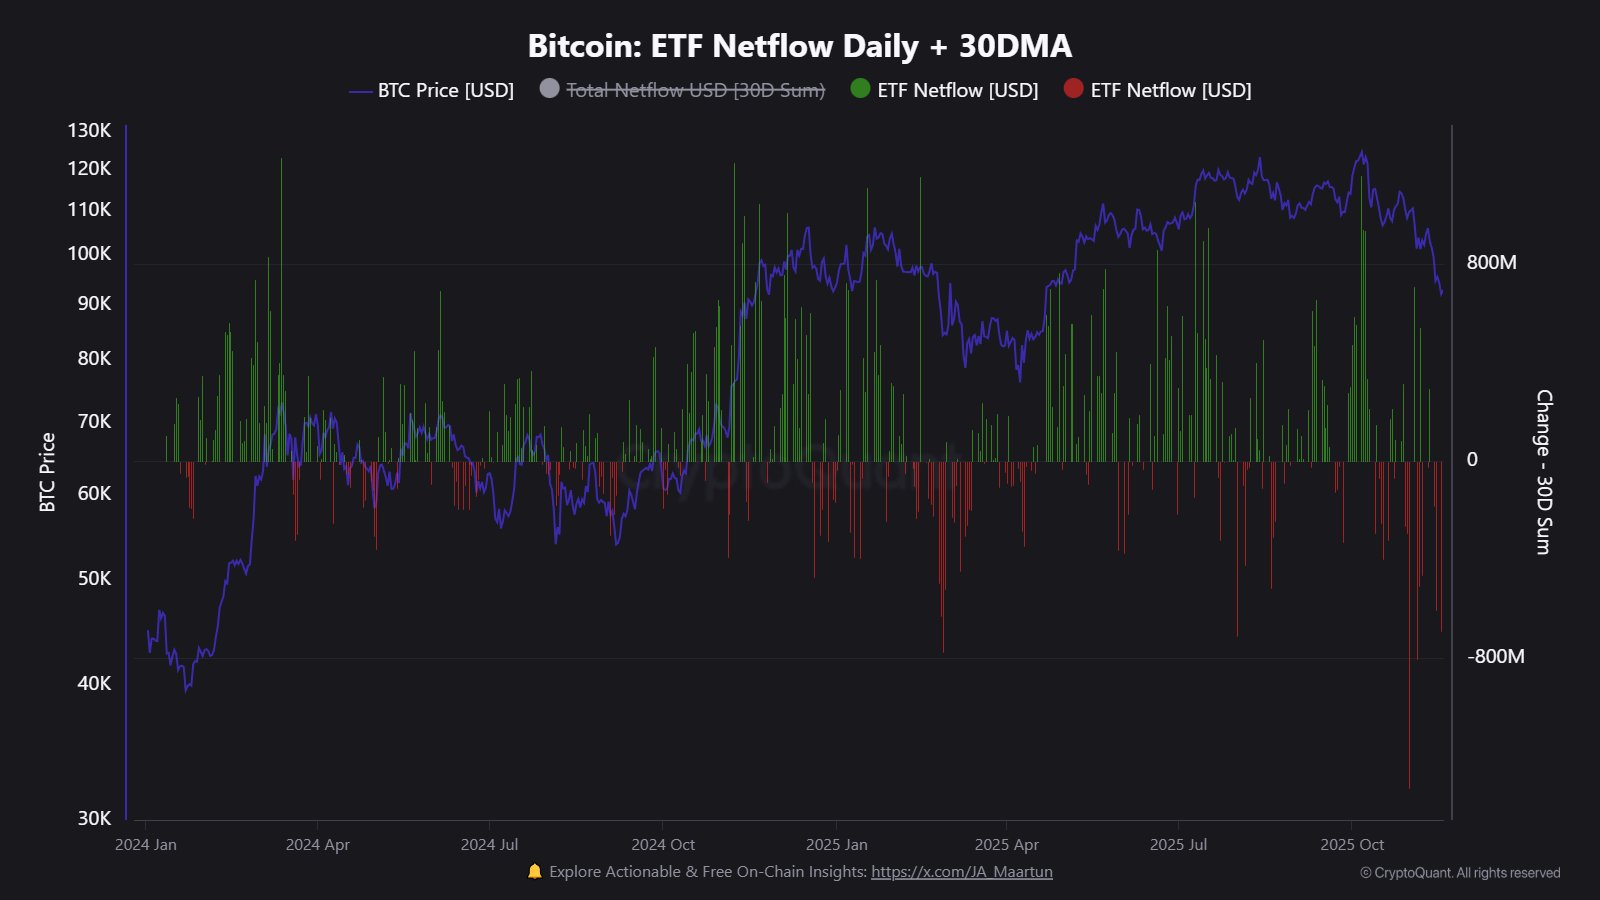
ETFs have seen net outflows for three straight weeks now, which is a departure from last year’s Q4 trend, where 194,000 BTC flowed into the wallets connected with these funds, but in Q4 2025 so far, 8,000 BTC has flowed out instead. “ETF outflows continue to weigh on the BTC spot market,” noted CryptoQuant.
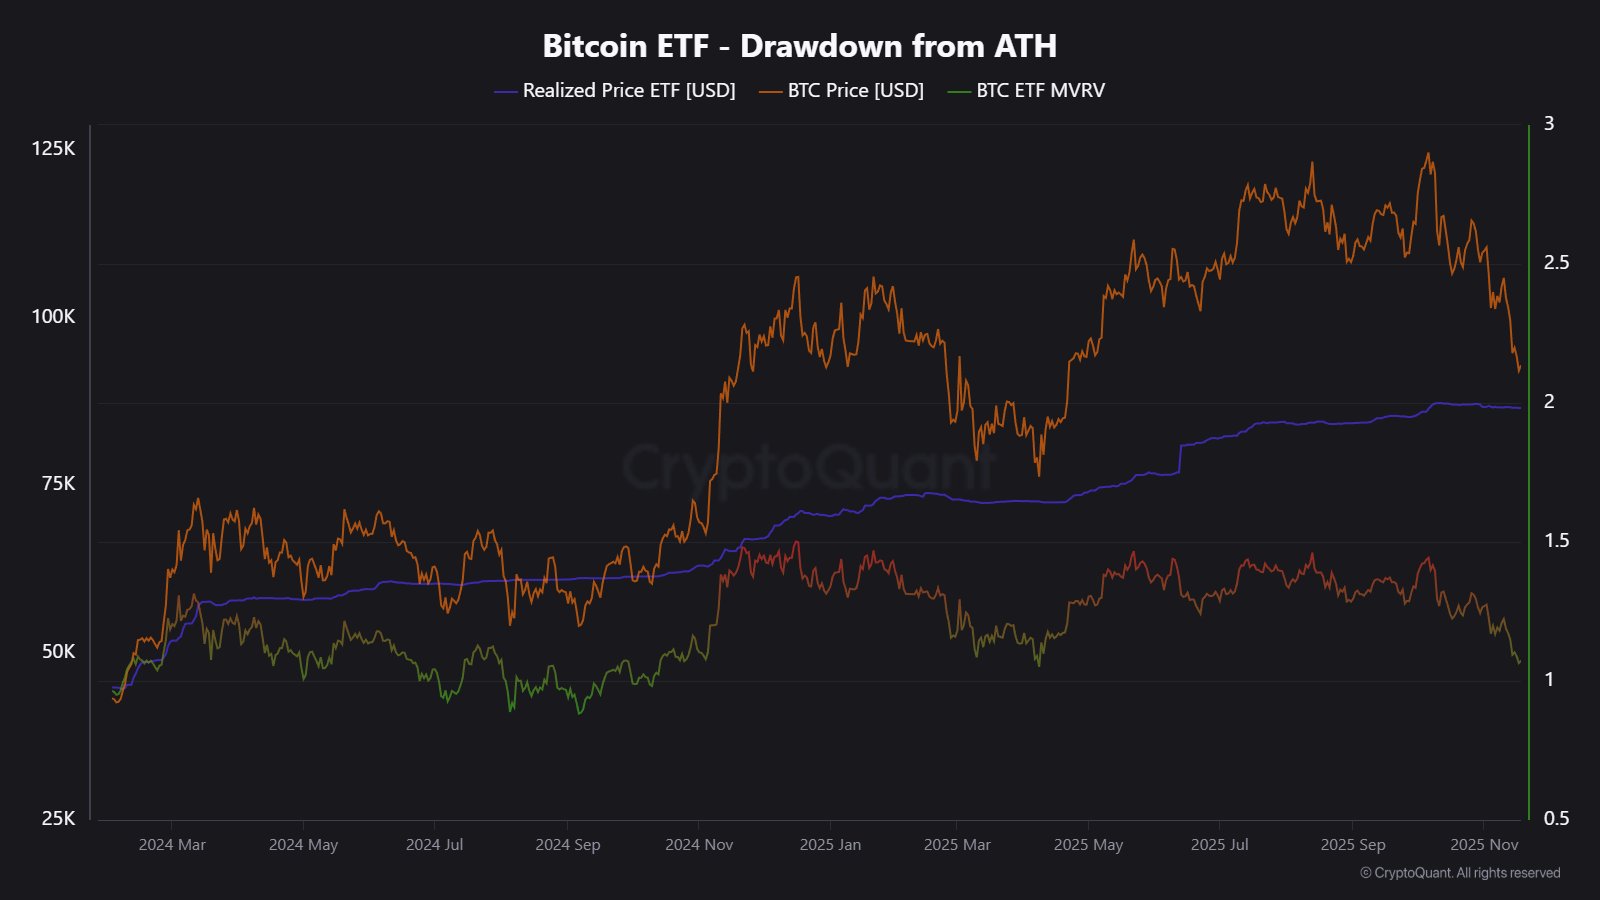
As for what could be next for Bitcoin, the cost basis of the spot ETFs may be worth watching for, which is located at $86,566. If the cryptocurrency breaches below this mark, holdings of the spot ETFs will go underwater.
BTC Price
At the time of writing, Bitcoin is floating around $92,000, down more than 10% over the last seven days.


You May Also Like

Strategy’s High-Yield Stock Will Continue to Fuel Bitcoin Surge, Says Bitwise CIO

WTI Hovers Around $97.00: US Iran Blockade Extension Sparks Supply Fears


