

De huidige structuur van de XRP toont al geruime tijd een brede consolidatie. De prijs beweegt relatief stabiel, zonder een duidelijke opwaartse trend, wat duidtDe huidige structuur van de XRP toont al geruime tijd een brede consolidatie. De prijs beweegt relatief stabiel, zonder een duidelijke opwaartse trend, wat duidt
Is de XRP koers rijp voor een impuls naar $11 na een recordlange consolidatie?
For feedback or concerns regarding this content, please contact us at crypto.news@mexc.com
De huidige structuur van de XRP toont al geruime tijd een brede consolidatie. De prijs beweegt relatief stabiel, zonder een duidelijke opwaartse trend, wat duidt op een langdurige accumulatie. Volgens crypto-analist CryptoBull lijkt deze fase sterk op eerdere periodes die voorafgingen aan grote impulsbewegingen, maar de huidige consolidatie duurt duidelijk langer. Kan de XRP koers hierdoor later sterker reageren dan in voorgaande marktfases? Check onze Discord Connect met "like-minded" crypto enthousiastelingen Leer gratis de basis van Bitcoin & trading - stap voor stap, zonder voorkennis. Krijg duidelijke uitleg & charts van ervaren analisten. Sluit je aan bij een community die samen groeit. Nu naar Discord XRP koers: de structuur ervan binnen een langdurige consolidatie De XRP koers beweegt al maanden tussen een vaste steun en weerstand. Die prijszones zijn al meerdere keren getest. Elke koersdaling richting de onderkant van het bereik wordt opgevangen. Elke koersstijging richting de bovenkant wordt afgeremd. Dit gedrag wijst niet op zwakte, maar op een balans. Bij dit soort structuren wordt het aanbod langzaam geabsorbeerd. De bears verkopen de XRP tokens, maar krijgen de prijs niet verder omlaag. Dit betekent dat er aan de kant van de bulls voldoende vraag is om de druk hiervan op te vangen. Tegelijkertijd kopen de bulls niet agressief bij, waardoor de prijs stabiel blijft. Dit proces zie je vaak bij markten die zich op een grotere koersbeweging voorbereiden. Niet omdat dit gegarandeerd is, maar omdat het aantal tokens dat er tegen lage prijzen beschikbaar is afneemt. Zodra deze weerstandzone wordt doorbroken, is er direct minder verkoopdruk. De huidige structuur lijkt sterk op de accumulatiefase vóór de vorige grote XRP beweging. Toen bleef de prijs ook een lange tijd zijwaarts bewegen. Het verschil is echter dat de huidige fase aanzienlijk meer tijd in beslag neemt. In technische analyses wordt aangenomen dat langere consolidaties vaak tot grotere prijsbewegingen leiden, doordat de posities zich dan meer concentreren bij holders met een langere beleggingshorizon. Welke crypto nu kopen?Lees onze uitgebreide gids en leer welke crypto nu kopen verstandig kan zijn! Welke crypto nu kopen? Het nieuwe jaar is net begonnen en er is een nieuwe Amerikaanse wet die de cryptomarkt op zijn kop zou kunnen zetten. Dat zorgt ook voor veel nieuwe ontwikkelingen, en dus zien analisten kansen voor een flinke beweging omhoog. Eén vraag komt telkens terug: welke crypto moet je nu kopen? In dit… Continue reading Is de XRP koers rijp voor een impuls naar $11 na een recordlange consolidatie? document.addEventListener('DOMContentLoaded', function() { var screenWidth = window.innerWidth; var excerpts = document.querySelectorAll('.lees-ook-description'); excerpts.forEach(function(description) { var excerpt = description.getAttribute('data-description'); var wordLimit = screenWidth wordLimit) { var trimmedDescription = excerpt.split(' ').slice(0, wordLimit).join(' ') + '...'; description.textContent = trimmedDescription; } }); }); Waarom de XRP koers rond de $11 als eerste referentie geldt Binnen de technische projectie van CryptoBull komt $11 naar voren als eerste belangrijk referentiepunt. Dit prijsniveau is gebaseerd op eerdere zones waar de XRP koers duidelijke reacties liet zien. Historische prijszones fungeren vaak als ankerpunten, omdat daar eerder veel volume is verhandeld. Een koersbeweging richting dit prijsniveau zou de eerste duidelijke expansie zijn vanuit de huidige consolidatie. Het gaat hier niet om een directe sprong naar extreme niveaus, maar om een eerste structurele verschuiving. In technische termen is dit de eerste impuls na een lange compressie. Dit scenario blijft geldig zolang de XRP koers boven de onderkant van het huidige bereik blijft. Zakt de prijs daar structureel onder, dan vervalt het accumulatiescenario. Dit wijst dan op een hernieuwde dominantie van de bears. Dat gebeurt tot nu toe niet. De XRP prijs blijft binnen het bereik. Er zijn geen lagere bodems zichtbaar., en er is ook geen koersversnelling omlaag. Dat maakt shortposities minder logisch vanuit structureel oogpunt, omdat er geen bevestigde neerwaartse trend is. The next impulse will take #XRP to $11 and the last wave to $70. The price pattern is copying the previous bullrun, only difference is time, which makes sense, as we need longer accumulation for higher prices. pic.twitter.com/WJxzYDVRKT — CryptoBull (@CryptoBull2020) January 23, 2026 Tijdsduur als factor voor een grotere latere koersbeweging Een belangrijk verschil met eerdere XRP cycli is tijd. De huidige accumulatiefase duurt aanzienlijk langer. In marktstructuren betekent dit vaak dat de zwakke handen al zijn uitgestapt. De resterende XRP tokens zitten grotendeels bij holders die minder snel verkopen. Wanneer een markt met zo’n structuur uitbreekt, is het effect ervan vaak groter dan bij kortere consolidaties. Dat komt doordat de liquiditeit aan de bovenkant dunner wordt. Er zijn simpelweg minder tokens beschikbaar om direct winst te nemen. De lange tijdsduur wijst bovendien op een gecontroleerde positionering. Er is geen hype fase zichtbaar of een extreme leverage. Dat verkleint de kans op snelle koerscorrecties direct na een uitbraak, omdat er minder geforceerde liquidaties zijn. CryptoBull projecteert op basis van de volledige structuur ook hogere lange termijn niveaus, waaronder een prijszone rond de $70. Dit is echt geen korte termijn verwachting, maar een wiskundige projectie van het volledige bereik. Zulke projecties worden alleen relevant als eerdere fases, zoals de expansie richting $11, daadwerkelijk plaatsvinden. Waarom de bears weinig bevestiging krijgen vanuit het huidige patroon Voor de bears is deze structuur lastig. Er is geen neerwaartse trend. Er zijn geen lagere highs die versnellen. De XRP koers zakt ook niet door belangrijke steunzones heen. In plaats daarvan blijft de prijs samengedrukt. In technische analyses wijst dit vaak op afwachten vóór een duidelijke koersrichting, niet op een instorting. Zolang de onderkant van het bereik intact blijft, is er geen bevestiging voor een bearish scenario. Dit betekent niet dat een koersdaling onmogelijk is, maar wel dat deze niet door de huidige structuur wordt ondersteund. Het ontbreken van momentum omlaag is hier belangrijk. Als de bears werkelijk de controle hadden, zou de XRP prijs al door de steun zijn gezakt. Dat gebeurt niet. Elke poging daartoe wordt opgekocht. Vooruitblik op mogelijke vervolgstappen van de XRP koers De huidige structuur van de XRP koers laat een langdurige consolidatie zien met duidelijke grenzen. De prijs blijft boven de steun en faalt niet structureel. De duur van deze fase wijkt af van eerdere XRP cycli en wijst op een geconcentreerde accumulatie. Zolang de onderkant van het huidige bereik standhoudt, blijft het scenario van een latere expansie intact. Een eerste structurele verschuiving ligt bij eerdere historische prijszones rond de $11. Pas daarna worden de hogere projecties relevant. De komende koersfase draait dan ook niet om snelheid, maar om structuur en tijd. Best wallet - betrouwbare en anonieme wallet Best wallet - betrouwbare en anonieme wallet Meer dan 60 chains beschikbaar voor alle crypto Vroege toegang tot nieuwe projecten Hoge staking belongingen Lage transactiekosten Best wallet review Koop nu via Best Wallet Let op: cryptocurrency is een zeer volatiele en ongereguleerde investering. Doe je eigen onderzoek.
Het bericht Is de XRP koers rijp voor een impuls naar $11 na een recordlange consolidatie? is geschreven door Dirk van Haaster en verscheen als eerst op Bitcoinmagazine.nl.


Disclaimer: The articles reposted on this site are sourced from public platforms and are provided for informational purposes only. They do not necessarily reflect the views of MEXC. All rights remain with the original authors. If you believe any content infringes on third-party rights, please contact crypto.news@mexc.com for removal. MEXC makes no guarantees regarding the accuracy, completeness, or timeliness of the content and is not responsible for any actions taken based on the information provided. The content does not constitute financial, legal, or other professional advice, nor should it be considered a recommendation or endorsement by MEXC.
You May Also Like

Hard luck lands J-6er before tough Trump judge
President Donald Trump desperately wants to protect one of the people who helped him try to overturn the 2020 election — but the January 6er in question was just
Share
Alternet2026/05/15 10:15
Dartmouth Endowment Adopts Solana ETF, Reaches $14M Crypto Exposure
Dartmouth College’s $9 billion endowment has quietly expanded its exposure to digital assets, reporting new crypto-related holdings in a recent SEC filing. In a
Share
Crypto Breaking News2026/05/15 10:05
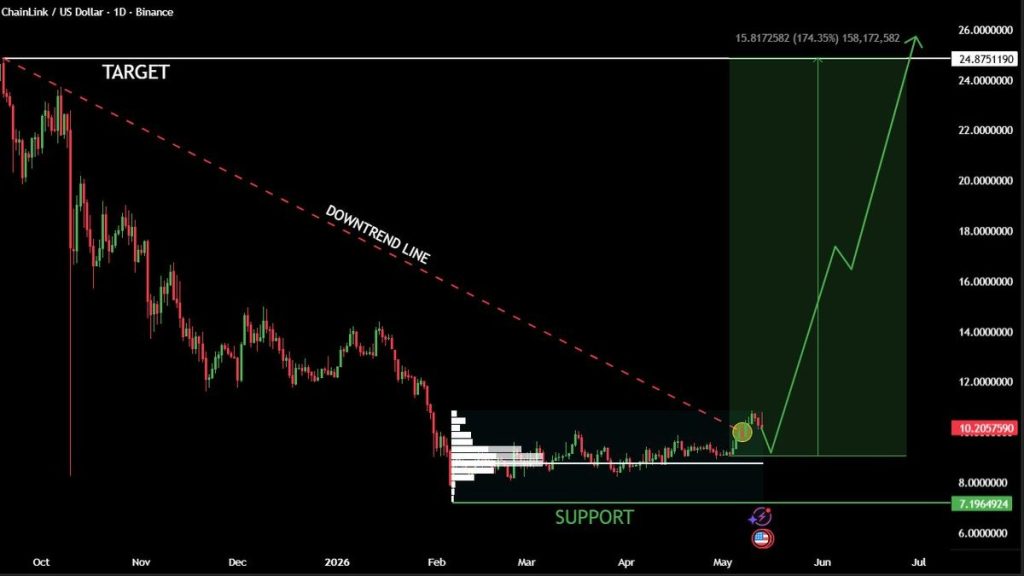
Analysts Believe This Could Be Chainlink (LINK) Biggest Technical Shift in Months – Here’s Why
Chainlink is starting to look very different from what traders have been used to over the past several months. The LINK price has successfully managed to breach
Share
Captainaltcoin2026/05/15 10:30


