

A prominent market analyst insists Ethereum still has more room to grow, calling attention to a confluence factor that could trigger the next leg up. Notably, Ethereum finds itself at a decisive point after reaching a new all-time high of $4,955 in August. Since then, the price has dropped 13%, but it continues to hold above $4,300 despite doubts about whether the bull run still has legs. Ethereum Still Has More Upside Potential Interestingly, market analyst EGRAG Crypto believes the rally has not ended. In his latest analysis, he argued that Ethereum could still climb much higher, even reaching $22,000, if it breaks out of a long-term ascending triangle pattern that has dictated price action for more than two years. For context, EGRAG's analysis looks at Ethereum's entire price history and focuses on important Fibonacci levels across three major cycles. In one accompanying chart, the analyst tracks how each cycle ended at specific Fibonacci extensions he calls "HITs." Ethereum Fib Hits | EGRAG Crypto Specifically, during the first major rally from 2015 to January 2018, Ethereum topped out above the 3.888 Fibonacci extension ($1,285) when it reached a peak of $1,420. This marked the top of Cycle One. Meanwhile, the second big run between 2018 and 2021 ended above the 1.414 Fibonacci extension ($4,266), with Ethereum soaring to a high of $4,868 by November 2021. This price set the Cycle Two high before the bear market hit. During the bear market, the 2022 crash dragged Ethereum to a low near $880, which started Cycle Three. From there, the price built a recovery path through several Fibonacci retracement levels: $2,052 at the 0.5 level, $2,882 at 0.702, and $3,942 at 0.888. The Confluence Factor: ETH Needs to Break the Ascending Triangle Notably, the 1.0 extension at $4,760 now acts as the major horizontal resistance line and the top boundary of the ascending triangle. With its price now at $4,378, Ethereum trades just below this level, holding steady after reclaiming those key retracement zones one by one. Meanwhile, another EGRAG chart focused on the ascending triangle, which stretches from the 2022 low through higher lows in 2023, 2024, and 2025. The top of the triangle sits at $4,760. This forms the breakout point EGRAG calls the confluence factor. Ethereum Ascending Triangle | EGRAG Crypto He explained that a breakout above this line would trigger three possible price targets based on different measurement methods. Specifically, a non-logarithmic projection points to $8,500, which lines up near the 1.272 Fibonacci extension at $7,522 and stays below the 1.414 level at $9,553. The average between logarithmic and non-logarithmic methods sets a midpoint target of $15,250, landing between the 1.414 and 1.618 extensions. However, the most aggressive target comes from the logarithmic method, which projects $22,000, aligning with VanEck's predictions. This would push Ethereum far above the 1.618 Fibonacci extension at $13,465, repeating the kind of late-cycle overshoot from earlier rallies. EGRAG noted that every past cycle has topped at one of these extension levels. For context, Cycle One ended at 3.888, while Cycle Two stopped at 1.414. For the current cycle, the key levels stand at 1.272, 1.414, and 1.618, with the $4,760 breakout level serving as the trigger for the next big move. Other Analysts Agree Interestingly, other analysts also believe Ethereum still has more growth potential this cycle. In an analysis today, veteran trader Michaël van de Poppe compared Ethereum's current setup to late 2019 or early 2020 in the previous cycle. Ethereum Against Bitcoin | Michael van de Poppe He pointed out that Ethereum recently broke above its 20-week exponential moving average after the longest bear market in its history, signaling the start of a lasting uptrend rather than a quick pump. Meanwhile, Web3 commentator Zyn also highlighted that Ethereum ended a four-year downtrend, set a new all-time high, and now retests the breakout level as support. He believes this kind of setup often leads to another major rally. https://twitter.com/Zynweb3/status/1962811739638243476A prominent market analyst insists Ethereum still has more room to grow, calling attention to a confluence factor that could trigger the next leg up. Notably, Ethereum finds itself at a decisive point after reaching a new all-time high of $4,955 in August. Since then, the price has dropped 13%, but it continues to hold above $4,300 despite doubts about whether the bull run still has legs. Ethereum Still Has More Upside Potential Interestingly, market analyst EGRAG Crypto believes the rally has not ended. In his latest analysis, he argued that Ethereum could still climb much higher, even reaching $22,000, if it breaks out of a long-term ascending triangle pattern that has dictated price action for more than two years. For context, EGRAG's analysis looks at Ethereum's entire price history and focuses on important Fibonacci levels across three major cycles. In one accompanying chart, the analyst tracks how each cycle ended at specific Fibonacci extensions he calls "HITs." Ethereum Fib Hits | EGRAG Crypto Specifically, during the first major rally from 2015 to January 2018, Ethereum topped out above the 3.888 Fibonacci extension ($1,285) when it reached a peak of $1,420. This marked the top of Cycle One. Meanwhile, the second big run between 2018 and 2021 ended above the 1.414 Fibonacci extension ($4,266), with Ethereum soaring to a high of $4,868 by November 2021. This price set the Cycle Two high before the bear market hit. During the bear market, the 2022 crash dragged Ethereum to a low near $880, which started Cycle Three. From there, the price built a recovery path through several Fibonacci retracement levels: $2,052 at the 0.5 level, $2,882 at 0.702, and $3,942 at 0.888. The Confluence Factor: ETH Needs to Break the Ascending Triangle Notably, the 1.0 extension at $4,760 now acts as the major horizontal resistance line and the top boundary of the ascending triangle. With its price now at $4,378, Ethereum trades just below this level, holding steady after reclaiming those key retracement zones one by one. Meanwhile, another EGRAG chart focused on the ascending triangle, which stretches from the 2022 low through higher lows in 2023, 2024, and 2025. The top of the triangle sits at $4,760. This forms the breakout point EGRAG calls the confluence factor. Ethereum Ascending Triangle | EGRAG Crypto He explained that a breakout above this line would trigger three possible price targets based on different measurement methods. Specifically, a non-logarithmic projection points to $8,500, which lines up near the 1.272 Fibonacci extension at $7,522 and stays below the 1.414 level at $9,553. The average between logarithmic and non-logarithmic methods sets a midpoint target of $15,250, landing between the 1.414 and 1.618 extensions. However, the most aggressive target comes from the logarithmic method, which projects $22,000, aligning with VanEck's predictions. This would push Ethereum far above the 1.618 Fibonacci extension at $13,465, repeating the kind of late-cycle overshoot from earlier rallies. EGRAG noted that every past cycle has topped at one of these extension levels. For context, Cycle One ended at 3.888, while Cycle Two stopped at 1.414. For the current cycle, the key levels stand at 1.272, 1.414, and 1.618, with the $4,760 breakout level serving as the trigger for the next big move. Other Analysts Agree Interestingly, other analysts also believe Ethereum still has more growth potential this cycle. In an analysis today, veteran trader Michaël van de Poppe compared Ethereum's current setup to late 2019 or early 2020 in the previous cycle. Ethereum Against Bitcoin | Michael van de Poppe He pointed out that Ethereum recently broke above its 20-week exponential moving average after the longest bear market in its history, signaling the start of a lasting uptrend rather than a quick pump. Meanwhile, Web3 commentator Zyn also highlighted that Ethereum ended a four-year downtrend, set a new all-time high, and now retests the breakout level as support. He believes this kind of setup often leads to another major rally. https://twitter.com/Zynweb3/status/1962811739638243476
Analyst Expects Ethereum to Target $22,000 Once This Confluence Factor Falls Into Place
For feedback or concerns regarding this content, please contact us at crypto.news@mexc.com
A prominent market analyst insists Ethereum still has more room to grow, calling attention to a confluence factor that could trigger the next leg up. Notably, Ethereum finds itself at a decisive point after reaching a new all-time high of $4,955 in August. Since then, the price has dropped 13%, but it continues to hold above $4,300 despite doubts about whether the bull run still has legs. Ethereum Still Has More Upside Potential Interestingly, market analyst EGRAG Crypto believes the rally has not ended. In his latest analysis, he argued that Ethereum could still climb much higher, even reaching $22,000, if it breaks out of a long-term ascending triangle pattern that has dictated price action for more than two years. For context, EGRAG's analysis looks at Ethereum's entire price history and focuses on important Fibonacci levels across three major cycles. In one accompanying chart, the analyst tracks how each cycle ended at specific Fibonacci extensions he calls "HITs." 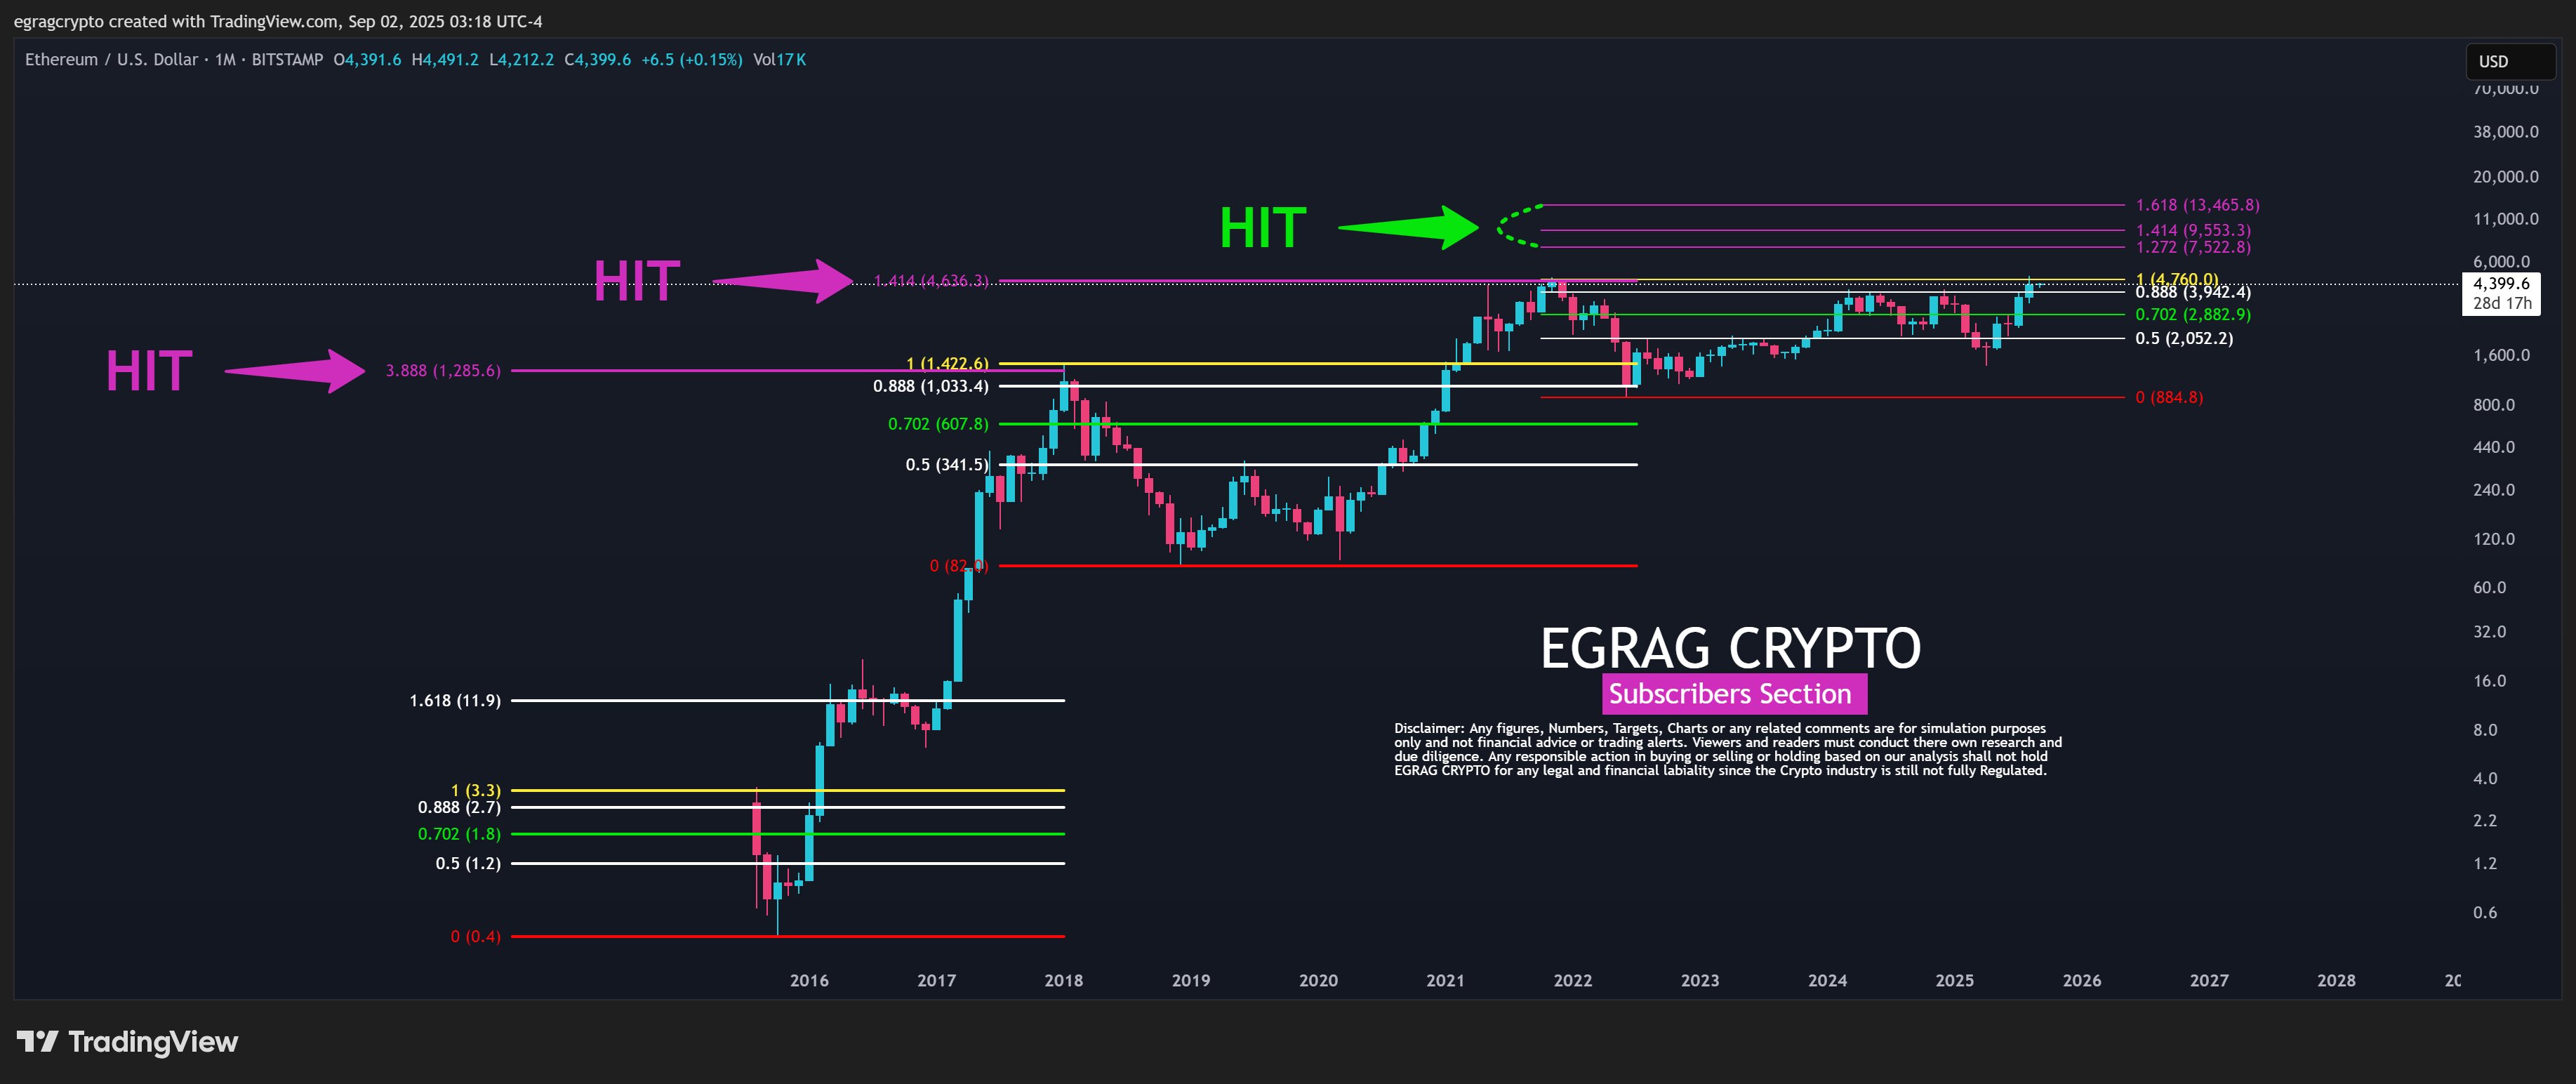 Ethereum Fib Hits | EGRAG Crypto Specifically, during the first major rally from 2015 to January 2018, Ethereum topped out above the 3.888 Fibonacci extension ($1,285) when it reached a peak of $1,420. This marked the top of Cycle One. Meanwhile, the second big run between 2018 and 2021 ended above the 1.414 Fibonacci extension ($4,266), with Ethereum soaring to a high of $4,868 by November 2021. This price set the Cycle Two high before the bear market hit. During the bear market, the 2022 crash dragged Ethereum to a low near $880, which started Cycle Three. From there, the price built a recovery path through several Fibonacci retracement levels: $2,052 at the 0.5 level, $2,882 at 0.702, and $3,942 at 0.888. The Confluence Factor: ETH Needs to Break the Ascending Triangle Notably, the 1.0 extension at $4,760 now acts as the major horizontal resistance line and the top boundary of the ascending triangle. With its price now at $4,378, Ethereum trades just below this level, holding steady after reclaiming those key retracement zones one by one. Meanwhile, another EGRAG chart focused on the ascending triangle, which stretches from the 2022 low through higher lows in 2023, 2024, and 2025. The top of the triangle sits at $4,760. This forms the breakout point EGRAG calls the confluence factor.
 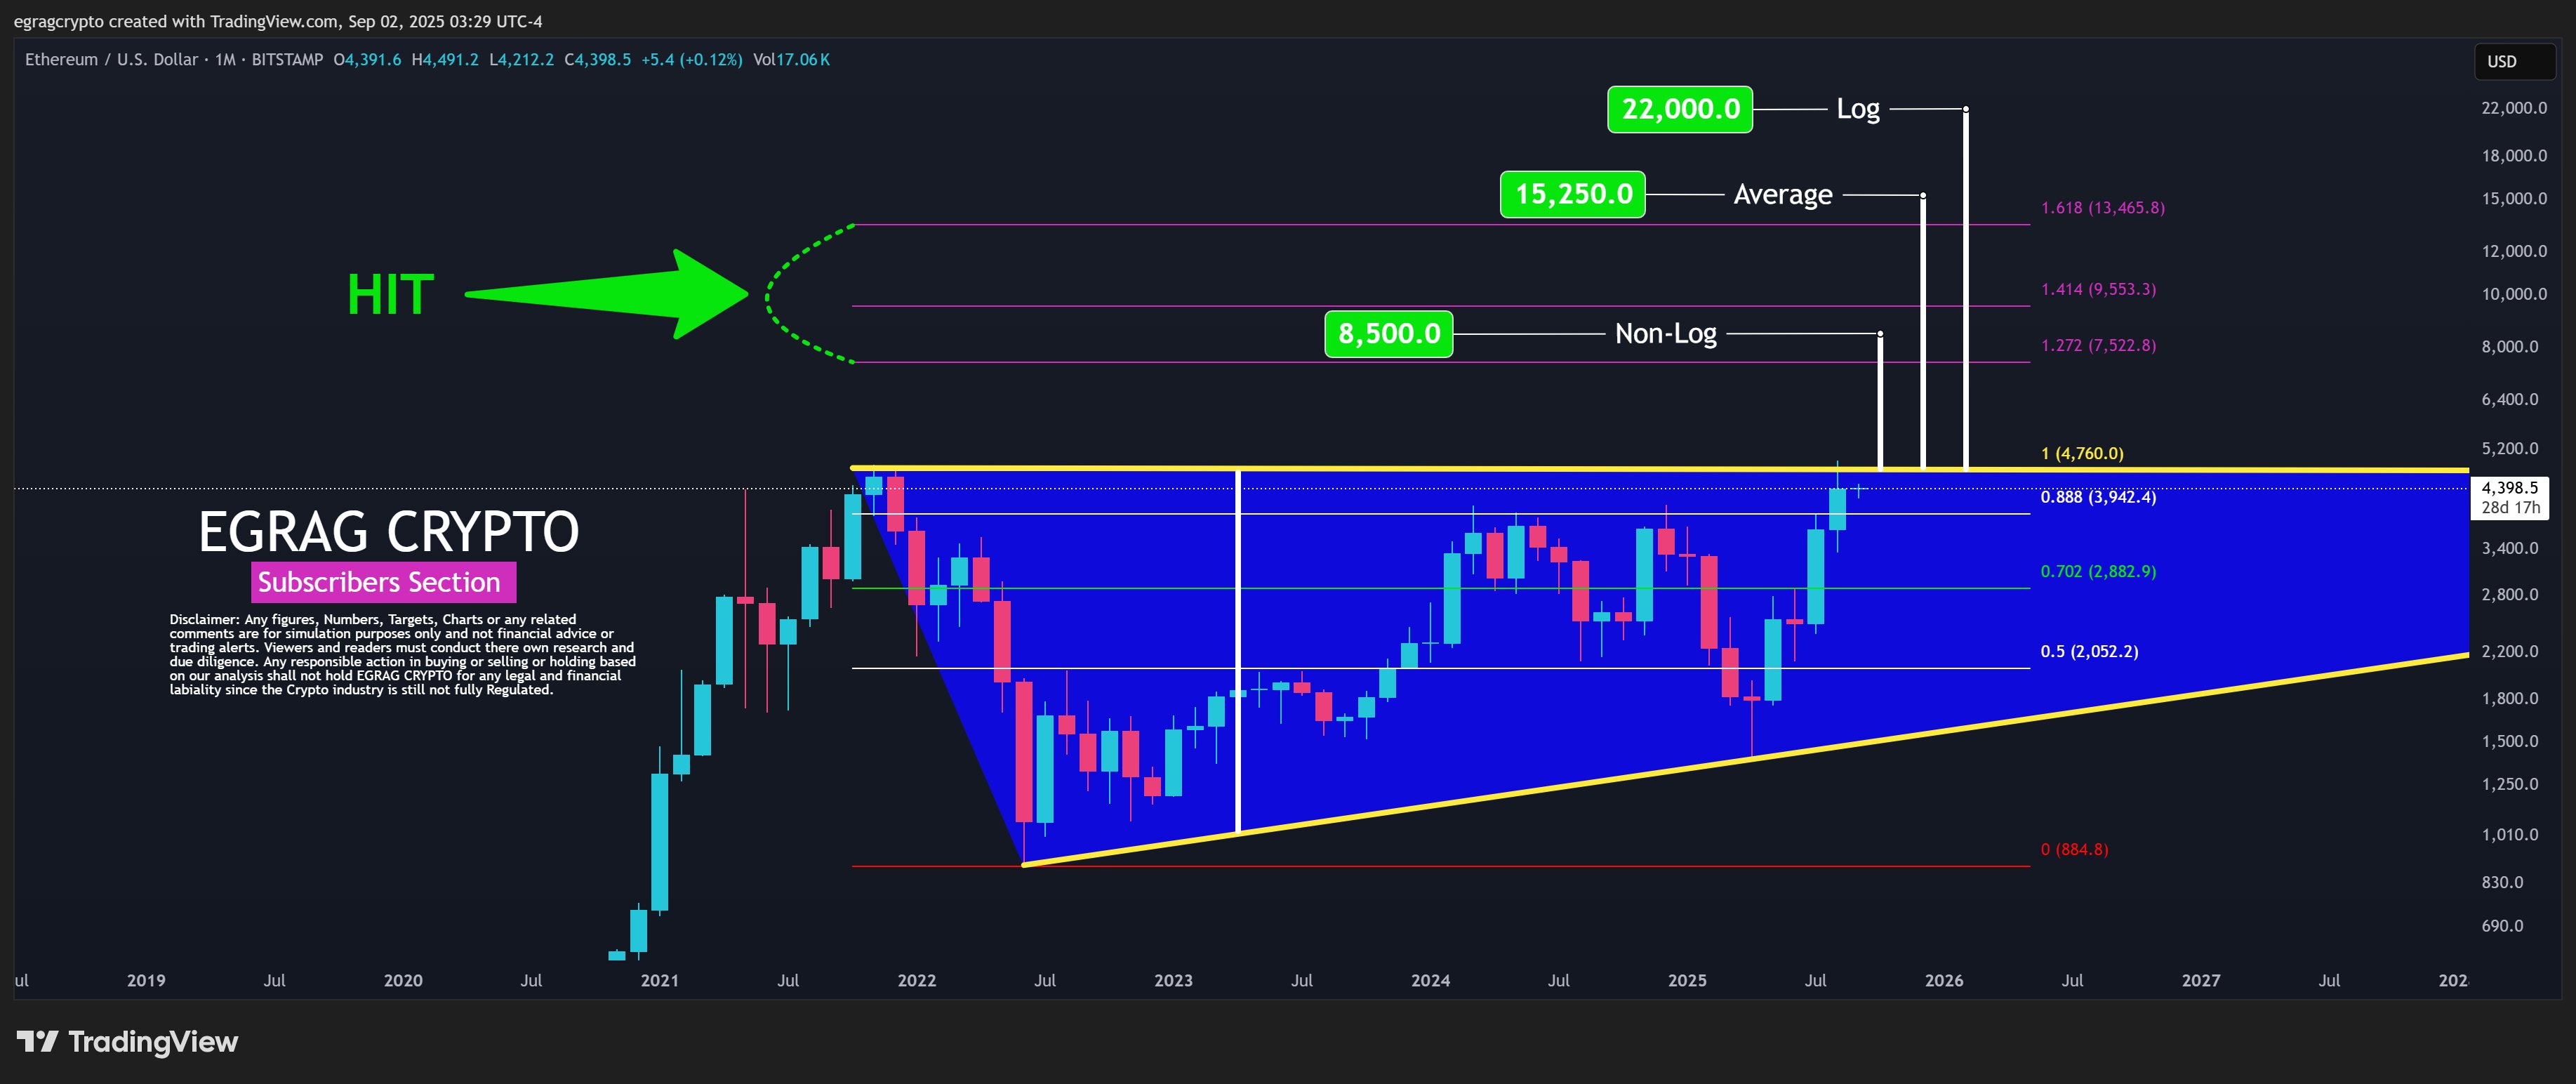 Ethereum Ascending Triangle | EGRAG Crypto He explained that a breakout above this line would trigger three possible price targets based on different measurement methods. Specifically, a non-logarithmic projection points to $8,500, which lines up near the 1.272 Fibonacci extension at $7,522 and stays below the 1.414 level at $9,553. The average between logarithmic and non-logarithmic methods sets a midpoint target of $15,250, landing between the 1.414 and 1.618 extensions. However, the most aggressive target comes from the logarithmic method, which projects $22,000, aligning with VanEck's predictions. This would push Ethereum far above the 1.618 Fibonacci extension at $13,465, repeating the kind of late-cycle overshoot from earlier rallies. EGRAG noted that every past cycle has topped at one of these extension levels. For context, Cycle One ended at 3.888, while Cycle Two stopped at 1.414. For the current cycle, the key levels stand at 1.272, 1.414, and 1.618, with the $4,760 breakout level serving as the trigger for the next big move. Other Analysts Agree Interestingly, other analysts also believe Ethereum still has more growth potential this cycle. In an analysis today, veteran trader Michaël van de Poppe compared Ethereum's current setup to late 2019 or early 2020 in the previous cycle.
 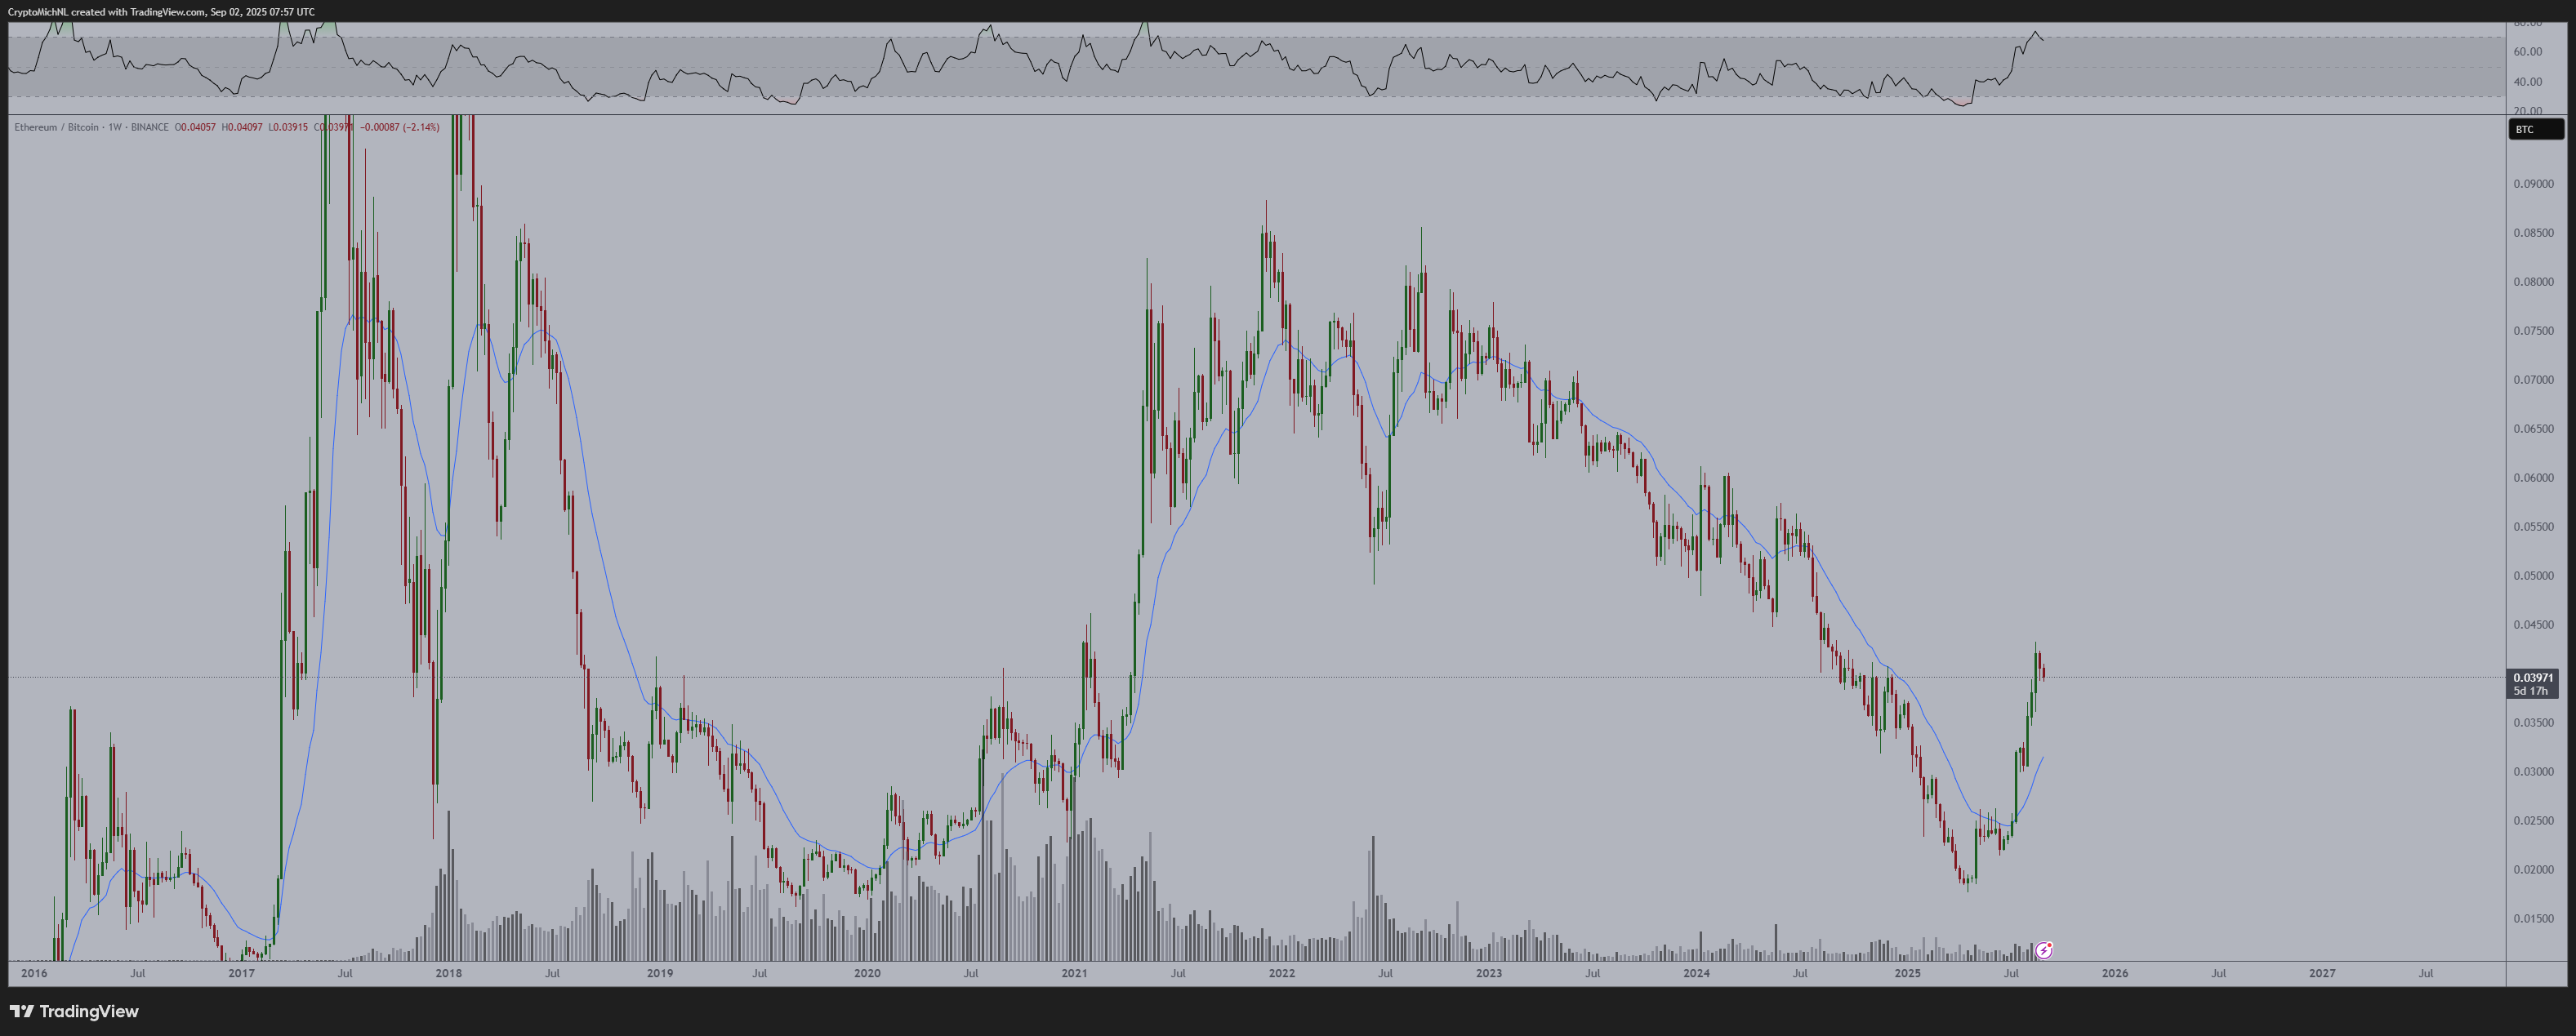 Ethereum Against Bitcoin | Michael van de Poppe He pointed out that Ethereum recently broke above its 20-week exponential moving average after the longest bear market in its history, signaling the start of a lasting uptrend rather than a quick pump. Meanwhile, Web3 commentator Zyn also highlighted that Ethereum ended a four-year downtrend, set a new all-time high, and now retests the breakout level as support. He believes this kind of setup often leads to another major rally. https://twitter.com/Zynweb3/status/1962811739638243476
Ethereum Fib Hits | EGRAG Crypto Specifically, during the first major rally from 2015 to January 2018, Ethereum topped out above the 3.888 Fibonacci extension ($1,285) when it reached a peak of $1,420. This marked the top of Cycle One. Meanwhile, the second big run between 2018 and 2021 ended above the 1.414 Fibonacci extension ($4,266), with Ethereum soaring to a high of $4,868 by November 2021. This price set the Cycle Two high before the bear market hit. During the bear market, the 2022 crash dragged Ethereum to a low near $880, which started Cycle Three. From there, the price built a recovery path through several Fibonacci retracement levels: $2,052 at the 0.5 level, $2,882 at 0.702, and $3,942 at 0.888. The Confluence Factor: ETH Needs to Break the Ascending Triangle Notably, the 1.0 extension at $4,760 now acts as the major horizontal resistance line and the top boundary of the ascending triangle. With its price now at $4,378, Ethereum trades just below this level, holding steady after reclaiming those key retracement zones one by one. Meanwhile, another EGRAG chart focused on the ascending triangle, which stretches from the 2022 low through higher lows in 2023, 2024, and 2025. The top of the triangle sits at $4,760. This forms the breakout point EGRAG calls the confluence factor. Ethereum Ascending Triangle | EGRAG Crypto He explained that a breakout above this line would trigger three possible price targets based on different measurement methods. Specifically, a non-logarithmic projection points to $8,500, which lines up near the 1.272 Fibonacci extension at $7,522 and stays below the 1.414 level at $9,553. The average between logarithmic and non-logarithmic methods sets a midpoint target of $15,250, landing between the 1.414 and 1.618 extensions. However, the most aggressive target comes from the logarithmic method, which projects $22,000, aligning with VanEck's predictions. This would push Ethereum far above the 1.618 Fibonacci extension at $13,465, repeating the kind of late-cycle overshoot from earlier rallies. EGRAG noted that every past cycle has topped at one of these extension levels. For context, Cycle One ended at 3.888, while Cycle Two stopped at 1.414. For the current cycle, the key levels stand at 1.272, 1.414, and 1.618, with the $4,760 breakout level serving as the trigger for the next big move. Other Analysts Agree Interestingly, other analysts also believe Ethereum still has more growth potential this cycle. In an analysis today, veteran trader Michaël van de Poppe compared Ethereum's current setup to late 2019 or early 2020 in the previous cycle. Ethereum Against Bitcoin | Michael van de Poppe He pointed out that Ethereum recently broke above its 20-week exponential moving average after the longest bear market in its history, signaling the start of a lasting uptrend rather than a quick pump. Meanwhile, Web3 commentator Zyn also highlighted that Ethereum ended a four-year downtrend, set a new all-time high, and now retests the breakout level as support. He believes this kind of setup often leads to another major rally. https://twitter.com/Zynweb3/status/1962811739638243476Market Opportunity
NEAR Price(NEAR)
$1.3319
$1.3319$1.3319
USD
NEAR (NEAR) Live Price Chart


Disclaimer: The articles reposted on this site are sourced from public platforms and are provided for informational purposes only. They do not necessarily reflect the views of MEXC. All rights remain with the original authors. If you believe any content infringes on third-party rights, please contact crypto.news@mexc.com for removal. MEXC makes no guarantees regarding the accuracy, completeness, or timeliness of the content and is not responsible for any actions taken based on the information provided. The content does not constitute financial, legal, or other professional advice, nor should it be considered a recommendation or endorsement by MEXC.
You May Also Like

High-Stakes Legal Drama Sees Artist Barred from Using Iconic NFT Imagery
The post High-Stakes Legal Drama Sees Artist Barred from Using Iconic NFT Imagery appeared on BitcoinEthereumNews.com. Conceptual artist Ryder Ripps has been officially
Share
BitcoinEthereumNews2026/04/09 10:15

The Most Accumulated Cheap Crypto? Why Investors Watch Mutuum Finance (MUTM)
While many established assets are navigating a period of sideways movement, a silent accumulation is taking place within the decentralized lending sector. This
Share
Techbullion2026/04/02 19:52

Hezbollah fires rockets at northern Israel, citing ceasefire breaches
STRIKE. Smoke following an Israeli strike in Bint Jbeil, southern Lebanon, as seen from the Israeli side of the border, April 8, 2026.
Share
Rappler2026/04/09 09:55


