

Bitcoin Price Prediction: BTC Tests $74K as Resistance Near $76K Draws Market Attention
Bitcoin price prediction trends have started to gain momentum as the cryptocurrency continues to appreciate beyond the $74,000 mark and is nearing the resistance zone near $76,000. Market players observed the price movements as the technical indicators, and blockchain showed signs of consolidating price structures. There were also signs of changes in the network as the price recovered. At the same time, discussions on social platforms outline a possible short-term market scenario if Bitcoin moves above the resistance band.
The social discussion and on-chain data appeared as Bitcoin continued to trade inside a narrow price range. Market watchers observed both technical resistance levels and blockchain activity indicators while assessing the next direction for the asset.
Bitcoin Approaches Key Resistance Zone
Bitcoin traded near $73,700 on the daily chart after recovering from a sharp decline earlier in the year. The asset formed higher lows since the February drop, showing a gradual recovery trend. Traders monitored a descending resistance trendline near the $75,000 to $76,000 region, where previous rallies stalled.
Price movement between rising support and descending resistance created a tightening structure. Such compression often occurs before a large directional move. Market participants watched this zone closely as Bitcoin attempted to test the upper boundary of the pattern.
Support levels remained visible near $71,000, where the short-term moving average and recent price consolidation aligned. If the asset holds above this region, price may continue testing upper resistance levels. However, failure to maintain support could push the asset toward lower liquidity zones seen earlier during the February sell-off.
Market Commentary Points to Liquidity Zones
A Crypto analyst discussed the resistance band in a post on X. The analyst noted that Bitcoin had moved above $74,000 and approached a heavy resistance area around $75,000 to $76,000.
According to the tweet, that region aligns with the entry level associated with Michael Saylor, whose company MicroStrategy holds a large Bitcoin reserve. The analyst described a potential market pattern where price briefly rises above $76,000 before reversing toward lower levels.
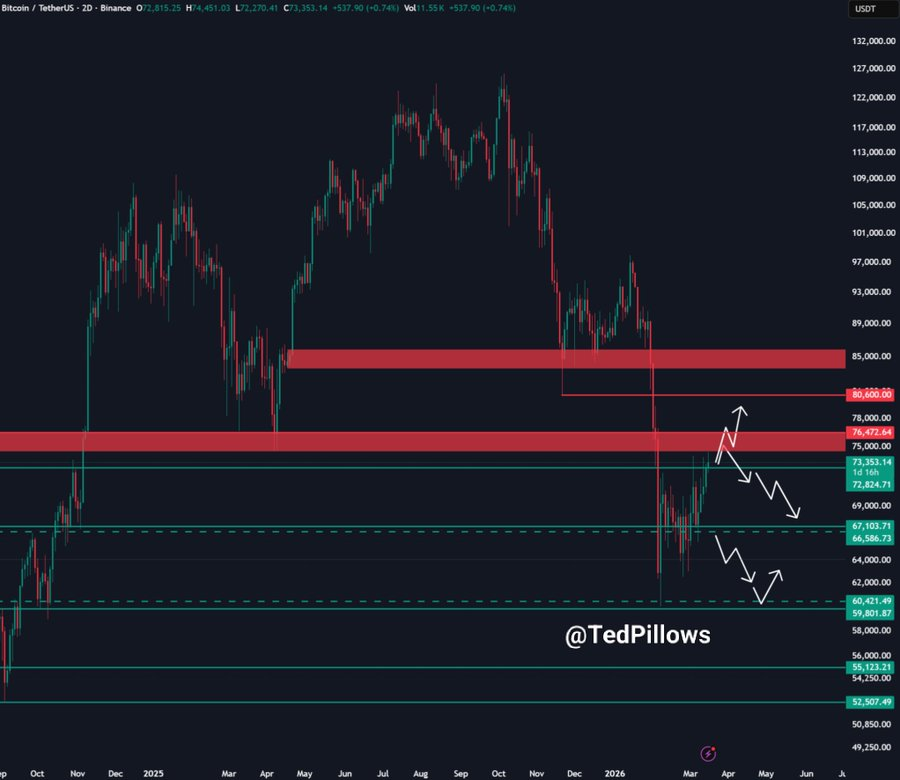
The scenario described a liquidity sweep above resistance followed by a move below the $60,000 zone. Analysts often track such price structures because resistance breakouts sometimes trigger stop orders and short-term volatility.
On-Chain Data Shows Changes in Network Activity
Blockchain data provided further insight into current market behavior. Statistics obtained from Glassnode revealed that the number of Bitcoin transactions was increasing towards 440,000 within the stated period. Higher transactional values indicate more people are joining the network as they react to changes in price.
Active address data showed that the levels of activity varied between 540,000 and 690,000 addresses. This shows that user activity in the network is ongoing, despite the recent market fluctuations.
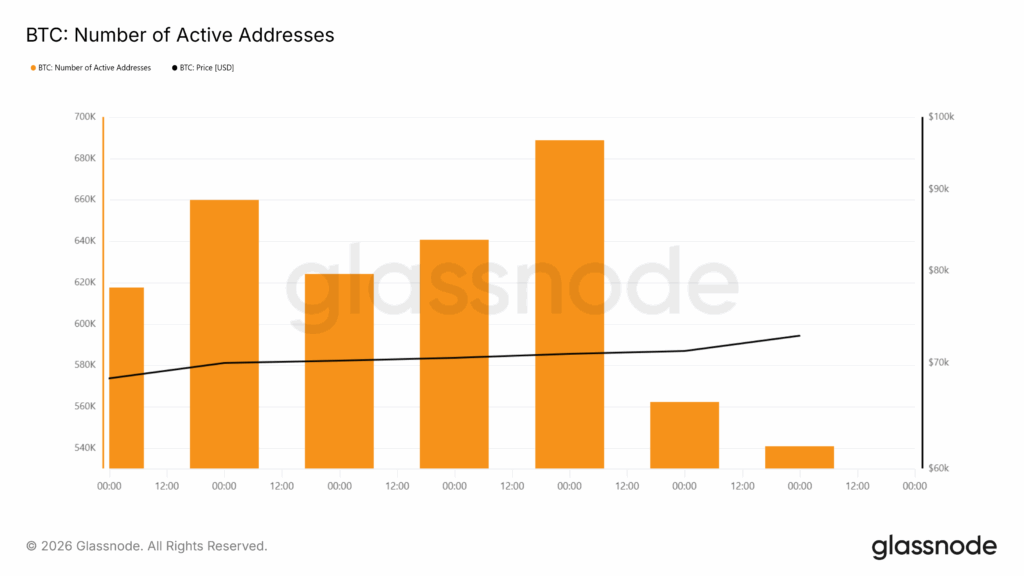 BTCs Number of Active Addresses
The data also showed that the total market valuation of Bitcoin was growing, with the value reaching $1.45 trillion during the recovery phase.
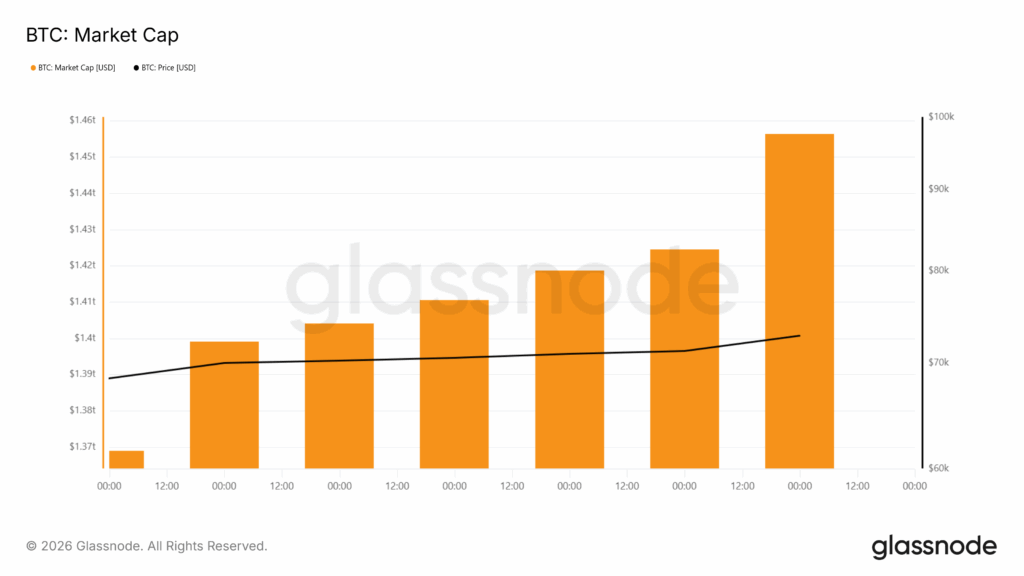 BTCs Market Cap
Technical Indicators Show Mixed Momentum
The technical indicators in the daily chart showed conflicting momentum. For example, the relative strength index was close to the 60 levels. This means that the price was moving moderately upwards but was not overbought.
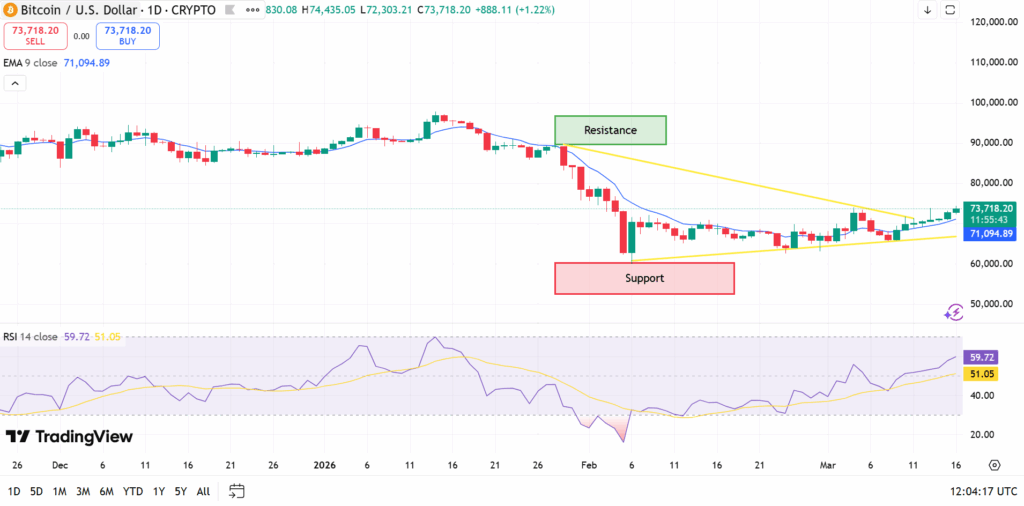 BTCs Daily Chart
In addition, the price was above the nine-day exponential moving average at $71,000. This moving average level was a key area that market players monitored to gauge market direction in the short term.
By remaining above this average, the market may sustain its attempts to test the resistance zone at $75,000 to $76,000. There was also support at the $67,000 zone and at the $60,000 zone. These regions have been areas of demand in the past when the market was falling.
Disclaimer: This analysis is based on market trends and does not guarantee future results. It should not be treated as financial advice. Cryptocurrency investments involve risk, so always do your own research (DYOR) before investing.


You May Also Like

Prediction markets get CFTC relief as legal battles widen

How and Where to Buy egoD (EGOD) Crypto: Complete Guide 2026


