NVIDIA Stock Crashed to Key Support: Is the 71% Yielding NVDY a Better Buy?
Key Insights
- NVIDIA stock price may drop further after moving to a crucial support level.
- The stock may drop further, potentially to $150 if it loses that support level.
- The 72% yielding NVDY ETF is doing better than NVDA stock this year.
NVIDIA stock price dropped by 1.15% in the pre-market session, reaching a low of $170, a crucial support that coincided with the lowest level in November and December last year and February this year. It has slumped by 20% from its all-time high. So, is the 72% yielding NVDY ETF a better buy today?
NVIDIA Stock Price is at Risk of a Steeper Dive
The daily chart shows that the NVDA share price has fallen from its all-time high of $212 in November last year to the current $170.
As a result, the stock has dropped below the 23.6% Fibonacci Retracement level as the sell-off has gained momentum.
Additionally, the stock has tumbled below the 50-day moving average. It also retreated below key trend indicators like the Ichimoku cloud and the Supertrend.
A closer look shows that the stock has formed a head-and-shoulders pattern, a common bearish reversal sign. This pattern consists of a head, which, in this case, costs $196. Its shoulders are at around $190, while the stock is now in its neckline.
The downtrend is gaining strength, with the Average Directional Index (ADX) having jumped to 17.50, its highest level since November 10 last year. A rising ADX indicates the sell-off is continuing.
Therefore, a drop below the support level at $170 will confirm the bearish outlook and potentially push it to the 50% Fibonacci Retracement level at $150. If this happens, the stock will likely drop by about 13% from the current level.
Losing the 50% retracement level will push the stock much lower, potentially to the 61.8% retracement at $135, down 22% from the current level.
 NVDA stock price chart | Source: TradingView
NVDA Stock is Falling Despite Major Tailwinds
The ongoing NVDA stock crash is happening despite the company having major tailwinds. For example, the company recently revealed plans to sell products worth over $1 trillion through 2027. These sales will be across its Blackwell and Vera Rubin chips.
In another major tailwind, Amazon reached a deal to buy 1 million chips from the company in the coming years. These orders are likely part of the $1 trillion sales that NVIDIA revealed at the GPU Technology Conference (GTC).
The company may soon start shipping its H200 chips to China, a country whose demand for chips continues rising. A deal to ship these chips will likely be reached when President Donald Trump travels to China in either April or May.
Most importantly, the company continues to report strong revenue and profitability numbers that constantly beat analysts’ estimates. For example, recent numbers showed that its revenue jumped to over $67 billion, and analysts believe annual revenue will reach $370 billion and $480 billion this year and in 2027, respectively.
Is NVDY ETF a Good Alternative as the NVDA Stock Crashes?
The ongoing NVIDIA stock price crash has pushed some investors to buy the YieldMax NVDA Option Income Strategy ETF (NVDY). The fund has added assets in the last three consecutive weeks, bringing its assets to over $1.3 billion.
Investors love the NVDY ETF because of its high dividend yield, which stands at 72%. It does this by leveraging the concept of covered calls: the fund manager buys a stock and sells call options, pocketing the premium.
Data shows that the NVDY ETF is beating the NVDA stock this year. Its total return is-2.65%, while NVDA stock has dropped by 7.40% over the same period.
 NVDY vs NVDA stock chart | Source: TradingView
While the NVDY ETF is beating NVDA stock, history shows that covered call funds often underperform the underlying assets in the long term.
For example, the JPMorgan Nasdaq Premium Equity (JEPQ) has risen 75% over the last three years, while the Nasdaq 100 Index has risen 93% over the same period.
The post NVIDIA Stock Crashed to Key Support: Is the 71% Yielding NVDY a Better Buy? appeared first on The Market Periodical.


You May Also Like
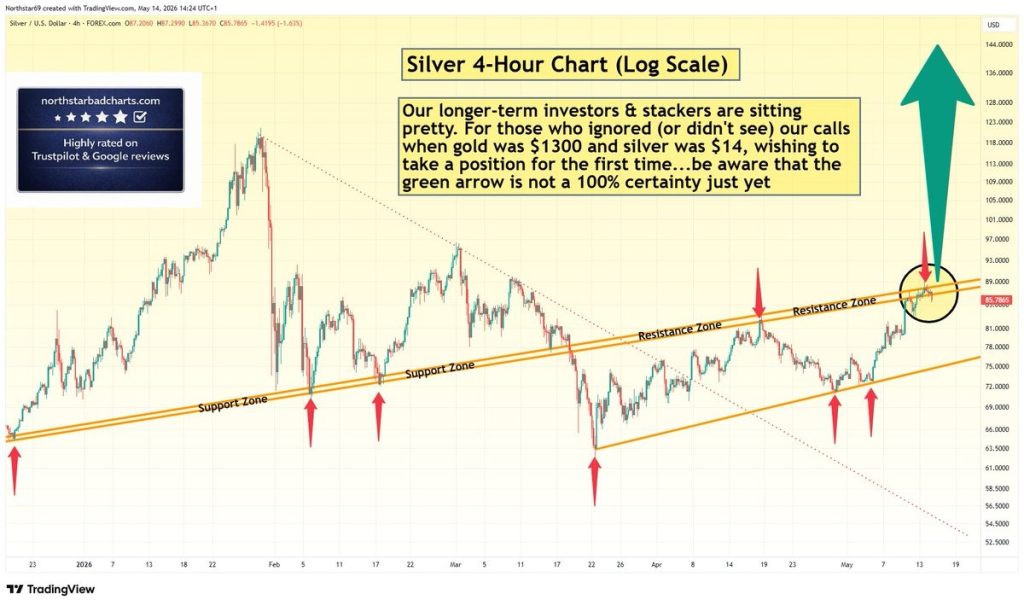
Silver Price Warning: Green Arrow Setup Is Not Confirmed – Wait for Clear Signal

Facebook spotlights African cinema in 6th ‘Made by Africa, loved by the world’ campaign