

Bitcoin Is Trading at 1.68x Its Structural Floor: Institutional Metric Shows How Much Room Remains Before Overvaluation
The Delta-Thermo Market Multiple, published on CryptoQuant, combines two on-chain cost basis measurements into a single ratio.
The Delta Cap represents the average institutional entry price, derived from the difference between realized cap and average cap. The Thermo Cap represents the total security cost paid to miners since Bitcoin’s inception, reflecting the cumulative economic investment in the network’s proof-of-work infrastructure. Adding those two figures produces what the analysis describes as a concrete floor, the aggregate structural cost basis of the two most economically significant participant groups in the market.
Dividing Bitcoin’s market capitalization by that combined floor produces the DTMM multiple. A reading of 1.0 means Bitcoin is trading exactly at its structural cost basis. A reading of 3.5 means Bitcoin is trading at 3.5 times that base, the level the framework identifies as the distribution zone where macro tops have historically formed.
What the Chart Shows
The CryptoQuant chart covering September 2025 through March 23, 2026 shows the DTMM multiple alongside Bitcoin’s price across the correction period. Reading left to right, the multiple opened the visible window above 3.0 in late September as Bitcoin was approaching its cycle high near $126,000 in October. The distribution zone above 3.5 is marked by the pink shaded area at the top of the chart, which Bitcoin’s price line briefly entered before reversing.
The decline through November and December brought both the price and the multiple lower in tandem. By late November the multiple had compressed from its cycle high toward the 2.5 expansion zone, and by December the price had corrected toward the $85,000 to $88,000 range. The multiple continued declining through January and February as the correction extended, eventually dropping below the 1.5 accumulation zone threshold as Bitcoin traded in the $64,000 to $67,000 range during February’s lows.
The current reading of 1.6, marked in the yellow label on the right of the chart, sits just above the 1.5 accumulation zone floor marked by the green shaded area at the bottom. Bitcoin’s price at $68,800 corresponds to a DTMM of 1.6, meaning the market is trading at a 60% premium above the combined structural cost basis of institutional average entry and miner security expenditure. The combined floor value at current readings represents approximately $819 billion in market capitalization terms.
The Three Zone Framework
The analysis identifies three mathematical thresholds that define the DTMM’s behavioral zones. The 1.5 multiple, corresponding to approximately $54,358 per coin at current structural floor calculations, represents the absolute floor of infrastructure cost and the realized price macro support. The 2.5 multiple marks the expansion zone where upside volatility gains traction and price momentum has historically been sustainable. The 3.5 multiple defines the distribution zone where macro tops form and institutional profit-taking concentrates.
At 1.6, Bitcoin sits 6.7% above the accumulation zone floor and approximately 56% below the expansion zone at 2.5. The distance between the current reading and the distribution zone at 3.5 represents the metric’s core argument: the asset is structurally cheap relative to where macro tops have historically occurred.
The Downside Ladder
The analysis identifies three specific price levels as downside protection if the current consolidation fails to hold. The $65,000 level was defended with high volume in recent sessions and represents the first tactical support below current price. The $60,000 level was tested and aggressively rejected on February 6, 2026, establishing it as a structurally significant floor. The $54,358 level corresponds to the 1.5 DTMM multiple and the realized price, representing the macro support where the average network cost basis sits.
The risk-reward framing the analysis presents is direct. With the DTMM at 1.6, downside to the structural floor at 1.5 represents approximately a 6% move in the multiple while upside to the distribution zone at 3.5 represents more than a 100% expansion. Whether that asymmetry plays out depends on whether the institutional and structural support identified by the metric proves as durable in practice as the historical data suggests it has been in prior cycles.
The post Bitcoin Is Trading at 1.68x Its Structural Floor: Institutional Metric Shows How Much Room Remains Before Overvaluation appeared first on ETHNews.


You May Also Like

EUR/GBP Exchange Rate Surges as Bank of England Rate Hike Expectations Intensify – Market Analysis
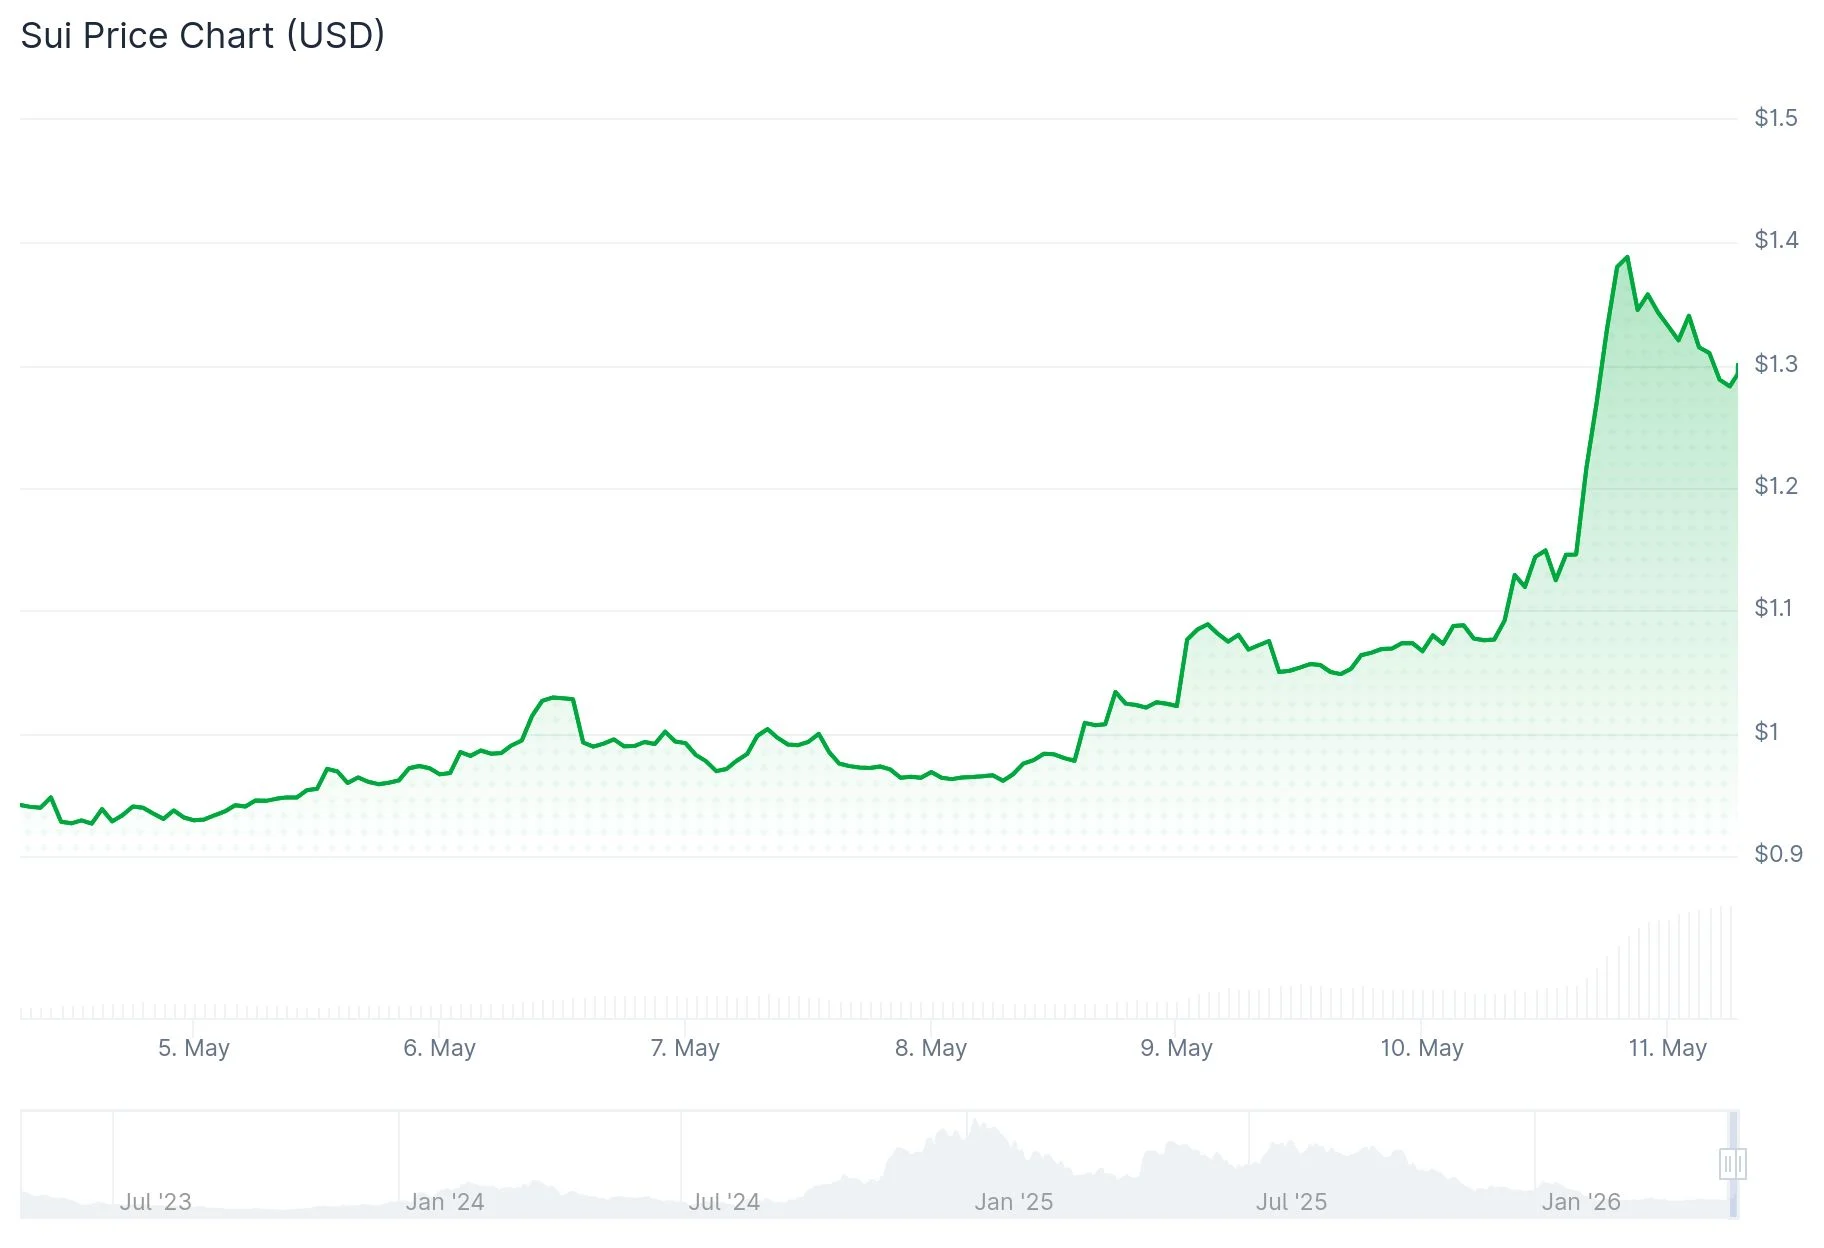
Sui (SUI) Token Rockets 50% Weekly on Institutional Staking and Privacy Tech Rollout


