2026-05-14 Thursday
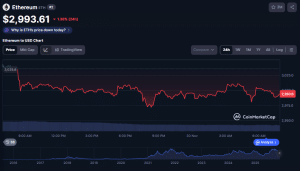
Ethereum News in Philippines
Follow top ETH trends and Ethereum ecosystem updates in Philippines

Ethereum’s Fusaka Upgrade May Enhance ETH Burn via L2-Mainnet Fee Ties
The post Ethereum’s Fusaka Upgrade May Enhance ETH Burn via L2-Mainnet Fee Ties appeared on BitcoinEthereumNews.com. The Ethereum Fusaka upgrade, scheduled for December 3, introduces EIP-7918 to link Layer-2 fees directly to mainnet gas costs, potentially increasing ETH burn through higher L2 contributions. This change, alongside throughput enhancements and raised gas limits, aims to boost network efficiency and user experience while sparking debates on long-term tokenomics. EIP-7918 establishes a baseline cost for L2 batch posting tied to mainnet execution, aligning secondary layer activity with Ethereum’s core fee mechanisms. Fusaka enhances overall performance with PeerDAS for better data throughput, reduced latency via preconfirmations, and a gas limit increase to 60 million. Corporate L2 projects like those from Coinbase and Robinhood may see elevated fee commitments, potentially amplifying ETH burn rates as adoption grows. Discover how the Ethereum Fusaka upgrade transforms L2 fees via EIP-7918, boosting ETH burn potential. Explore impacts on developers and users—stay ahead in crypto evolution today! What is the Ethereum Fusaka Upgrade? The Ethereum Fusaka upgrade represents a significant network evolution set for activation on December 3, designed to refine fee structures, enhance scalability, and improve accessibility. It primarily introduces EIP-7918, which ties Layer-2 solution costs to mainnet gas prices, creating a more integrated economic model. This adjustment, combined with other technical improvements, seeks to make Ethereum more efficient for everyday users and large-scale applications. How Does EIP-7918 Impact ETH Burn? EIP-7918 fundamentally alters the dynamics between Layer-2 chains and the Ethereum mainnet by imposing a minimum fee for batch posting that mirrors mainnet execution costs. Previously, L2 solutions contributed minimally to ETH burn rates because their base fees were negligible, limiting the overall impact of secondary layer activity on token deflation. Under this proposal, as L2 usage surges—driven by rollups and optimistic solutions—more ETH will be burned through aligned fee mechanisms, similar to the EIP-1559 model’s influence since 2021. Analysts, including those from…
Share
Author: BitcoinEthereumNews2025/12/01 04:51

Ethereum Price Prediction: ETH Price Pulls Back From $3,100 Rally as Technical Signals Point to $2,950 Retest
The post Ethereum Price Prediction: ETH Price Pulls Back From $3,100 Rally as Technical Signals Point to $2,950 Retest appeared on BitcoinEthereumNews.com. After surging past $3,100 on renewed optimism, Ethereum now faces a decisive moment as weakening short-term momentum collides with fresh institutional inflows that could reshape its near-term trend. Ethereum (ETH) has shown sharp price swings in recent weeks amid shifting technical signals, evolving ETF activity, and broader crypto market sentiment. While some indicators now suggest a cooling phase, sustained institutional participation continues to provide structural support beneath price action. Technical Indicators Suggest Short-Term Pullback Crypto analyst Ali recently pointed to exhaustion signals forming on Ethereum’s 1-hour perpetual futures chart on Binance. “The TD Sequential indicator is flashing a sell signal after Ethereum’s recent rally,” Ali noted, referring to the trend-exhaustion model developed by Tom DeMark, which is widely used to identify potential short-term reversals. Ali says a TD Sequential sell signal suggests Ethereum may see a short-term pullback after its rally above $3,100. Source: Ali Martinez via X From an independent chart perspective, the TD Sequential signal emerges after a rapid move from the $2,700 area to above $3,100—an extension that historically increases the probability of near-term consolidation rather than immediate continuation. At current levels near $3,050, the price is approaching zones where prior intraday rallies previously stalled, adding confluence to the cautionary signal. Ethereum is also trading within a descending channel on the 1-hour timeframe. This structure reflects a pattern of lower highs against relatively stable demand near the lower boundary. The Relative Strength Index (RSI), currently hovering near its lower range, supports the possibility of a short-lived rebound. However, unless ETH breaks and holds above the channel’s upper boundary with volume, rallies remain technically corrective rather than trend-confirming. Key support near $2,950 is derived from a cluster of prior reaction lows and short-term liquidity zones. If price revisits this level, it would represent a typical retracement of the…
Share
Author: BitcoinEthereumNews2025/12/01 03:35

Composite of ETH Valuation Models Places ETH Fair Value at $4,839: Analyst
The post Composite of ETH Valuation Models Places ETH Fair Value at $4,839: Analyst appeared on BitcoinEthereumNews.com. The native token of the Ethereum network, Ether (ETH), is undervalued in nine out of 12 commonly used valuation models, according to Ki Young Ju, a market analyst and CEO of crypto market analysis platform CryptoQuant. A composite “fair value” using all 12 valuation models prices ETH at about $4,836, an over 58% gain compared to its price at the time of this writing. Each valuation model was rated on a three-tiered scale for reliability, with three being the most reliable. Eight out of the 12 models feature a reliability rating of at least two. “These models were built by trusted experts across academia and traditional finance,” Ju said. 12 different ETH valuation models signal that ETH is undervalued at current market prices just north of $3,000. Source: ETHval The App Capital valuation model, which accounts for total on-chain assets, including stablecoins, ERC-20 tokens, non-fungible tokens (NFTs), real-world tokenized assets (RWAs), and bridged assets, prices ETH at a fair value of $4,918, according to ETHval. Using Metcalfe’s Law, which states that the value of a network grows in proportion to the square of real active users or the number of nodes in the network, projects an ETH price of $9,484, meaning the asset is over 211% undervalued, according to the model. Valuing ETH through the Layer-2 (L2) framework, which accounts for the total value locked (TVL) in Ethereum’s layer-2 scaling network ecosystem, projects a price of $4,633 per ETH, meaning that ETH is about 52% undervalued. The composite fair value of ETH over one year. Source: ETHval The Ethereum community and analysts continue to debate how to value the world’s first smart contract platform properly, with many saying that traditional valuation models are not sufficient to value nascent digital assets and decentralized blockchain networks. Related: Ethereum ICO whale cashes out…
Share
Author: BitcoinEthereumNews2025/12/01 03:23

Fidelity’s Ethereum Fund Tops $250M as ETH Breaks Out
The post Fidelity’s Ethereum Fund Tops $250M as ETH Breaks Out appeared on BitcoinEthereumNews.com. Fidelity’s tokenized money-market fund on Ethereum has quietly crossed the $250 million mark while ETH itself defends a fresh breakout above $3,000. Together, the fund’s inflows and the chart’s bullish structure underline how capital and price action are now aligning on the same chain. Fidelity Tokenized Ethereum Fund Crosses $250M AUM Fidelity’s tokenized money-market fund built on Ethereum has topped $250 million in assets under management (AUM), according to crypto trader Cryptorand. In a post on X, trader Rand said the fund passed the $250 million mark in November 2025. The chart shows a flat line until September. Then the AUM spikes sharply. After that, the total climbs in a steady stair-step pattern and moves past $250 million in late November. The fund launched earlier in 2025 as part of Fidelity’s push into on-chain financial products. It gives investors exposure to short-term money-market yields while settlement and ownership records live on Ethereum. This structure replaces off-chain transfer steps with direct, wallet-to-wallet updates on a shared ledger. As a result, AUM reporting tracks tokenized positions instead of traditional omnibus accounts. The light green trend on the chart signals persistent inflows since September. The first jump takes AUM from $0 to about $200 million. Next, stepwise increases lift the total near $225 million by early November. Finally, the fund expands again and crosses $250 million before month end. Rand also noted RWA (real-world asset) tokenization as a driver of the growth, tying the jump in AUM to broader on-chain demand for yield-bearing instruments. Ethereum hosts several tokenized funds, but this milestone highlights how regulated asset managers are deploying capital into yield products that run financial primitives in code. Meanwhile, Ethereum remains the base layer used for asset state updates, wallet settlement, and composable collateral logic, positioning it at the center of current…
Share
Author: BitcoinEthereumNews2025/12/01 03:18
Fidelity’s On-Chain Cash Fund Explodes Past $250M as ETH Surges
Fidelity’s tokenized money-market fund on Ethereum has quietly crossed the $250 million mark while ETH itself defends a fresh breakout above $3,000. Together, the fund’s inflows and the chart’s bullish structure underline how capital and price action are now aligning on the same chain.Fidelity Tokenized Ethereum Fund Crosses $250M AUMFidelity’s tokenized money-market fund built on Ethereum has topped $250 million in assets under management (AUM), according to crypto trader Cryptorand. In a post on X, trader Rand said the fund passed the $250 million mark in November 2025. The chart shows a flat line until September. Then the AUM spikes sharply. After that, the total climbs in a steady stair-step pattern and moves past $250 million in late November.The fund launched earlier in 2025 as part of Fidelity’s push into on-chain financial products. It gives investors exposure to short-term money-market yields while settlement and ownership records live on Ethereum. This structure replaces off-chain transfer steps with direct, wallet-to-wallet updates on a shared ledger. As a result, AUM reporting tracks tokenized positions instead of traditional omnibus accounts.The light green trend on the chart signals persistent inflows since September. The first jump takes AUM from $0 to about $200 million. Next, stepwise increases lift the total near $225 million by early November. Finally, the fund expands again and crosses $250 million before month end. Rand also noted RWA (real-world asset) tokenization as a driver of the growth, tying the jump in AUM to broader on-chain demand for yield-bearing instruments.Ethereum hosts several tokenized funds, but this milestone highlights how regulated asset managers are deploying capital into yield products that run financial primitives in code. Meanwhile, Ethereum remains the base layer used for asset state updates, wallet settlement, and composable collateral logic, positioning it at the center of current tokenized money-market expansion.Ethereum Forms Bullish Breakout-Retest Pattern, Analyst SaysEthereum (ETH) is tracing a textbook bullish structure, chart analyst James Bull said on X. His 4-hour TradingView chart shows ETH breaking out of a downtrend, pulling back to the former resistance line and holding it as support near $3,000.Ethereum Bullish Breakout Retest Setup On 4 Hour Chart. Source: Jamesbull1234From that base, Bull maps a rising trendline with higher lows and projected higher highs. Two yellow circles mark expected retests of the trendline, followed by an arrow toward the mid-$3,000 area, outlining a potential continuation of the move if support keeps holding.
Share
Author: Coinstats2025/12/01 03:16

Ethereum koers richting $4.500 door 55% Pectra effect en herstel huidige structuur?
De recente daling van de Ethereum exchange reserves en een stevige koersbeweging in de afgelopen maand vormen op dit moment de belangrijkste aanjagers voor het marktsentiment. ETH liet een koersdaling van circa 21% zien in de afgelopen dertig dagen. Tegelijk toont de grafiek hogere bodems, wat wijst op een sterkere marktstructuur. Deze combinatie wordt ondersteund door een bullish MACD crossover. Duwt dit de Ethereum koers weer omhoog? Check onze Discord Connect met "like-minded" crypto enthousiastelingen Leer gratis de basis van Bitcoin & trading - stap voor stap, zonder voorkennis. Krijg duidelijke uitleg & charts van ervaren analisten. Sluit je aan bij een community die samen groeit. Nu naar Discord De Ethereum koers reageert op de dalende exchange reserves De daling van de exchange supply zorgt ervoor dat grote verkoopblokken minder zichtbaar worden. Dit kan leiden tot een stabieler koersverloop wanneer Ethereum belangrijke zones nadert. De supply in dit soort datapunten is eenvoudig te controleren via bekende on-chain datasets. Een lagere supply op exchanges betekent dat de bears minder directe verkoopmacht hebben, omdat zij eerst de ETH tokens moeten verplaatsen voordat zij deze kunnen verkopen. De Ethereum grafiek laat daarnaast een reeks van hogere bodems zien. Dit gebeurt meestal wanneer de bulls telkens iets boven het vorige dieptepunt instappen. In dit geval lag een eerdere bodem rond het gebied net onder $2.800. Daarna kwam er een opwaartse reactie richting een afgerond koersgebied rond $3.000. Dit zijn geen actuele standen, maar afgeronde niveaus die bij recente prijszones aansluiten. De prijszone rond $3.058, die in eerdere koersbewegingen meerdere afwijzingen gaf, blijft belangrijk. De markt reageerde daar in het verleden met duidelijke candles die telkens naar beneden draaiden. Wanneer een markt meerdere keren op exact dezelfde plek draait, kan dat duiden op een sterke concentratie van verkooporders. Als deze zone overtuigend wordt terugveroverd, ontstaat er ruimte richting een volgend prijsgebied dat eerder rond $3.600 lag. Ook deze niveaus blijven benaderingen op basis van eerdere ETH prijsreacties. Technische structuur ondersteunt de ETH koers op de middellange termijn De MACD crossover is onderdeel van de huidige technische opbouw. Deze indicator is een momentum tool die het verschil tussen twee gemiddelden meet. Wanneer de lijn vanuit een lagere zone omhoog kruist, wijst dit op een verandering in het tempo van de koersbeweging. Het is een controleerbare indicator die in de huidige Ethereum markt scherp omhoog draait. De ETH grafiek laat daarnaast een duidelijk regressie kanaal zien dat lange tijd neerwaarts gericht was. Ethereum beweegt inmiddels dichter bij de bovenkant van dat kanaal. Dit geeft aan dat bulls sterker worden binnen dezelfde structuur. Wanneer een asset langere tijd onder druk staat en vervolgens richting de bovenkant van een trendkanaal klimt, wijst dat vaak op het einde van een fase waarin de bears de overhand hadden. Er is ook een historische Ethereum vergelijking gemaakt door een marktanalist. Deze keek naar de Pectra upgrade in mei 2025. Tijdens die periode steeg Ethereum in 35 dagen met 55% en in 109 dagen met 168%. Dit zijn controleerbare cijfers uit eerdere ETH cycli. Zijn analyse legt vooral de nadruk op hoe een grote upgrade soms samenvalt met een koersbeweging die al zichtbaar was in de grafiek. Binnenkort volgt de FUSAKA upgrade op 3 december 2025. Dezelfde crypto-analist koppelt deze gebeurtenis aan een projectie die in de buurt ligt van eerdere doelzones. Zijn model geeft een mogelijke stijging richting een afgerond koersniveau rond $4.500 binnen vijf weken na de upgrade. Hoewel dit een externe verwachting is, sluit het wel aan bij de Ethereum structuur die momenteel zichtbaar is. Er bestaat daarnaast een latere projectie richting $7.800, maar die valt buiten de huidige tijdsperiode. $ETH Could Skyrocket to $7.8K After FUSAKA Upgrade – History Shows The last Ethereum Pectra Upgrade on 7 May 2025 triggered a massive move: ✅ +55% in 35 days ✅ +168% in 109 days What’s next? The FUSAKA Upgrade is scheduled for 3 December 2025. If history repeats: Target… pic.twitter.com/ojZXLQSYWZ — Crypto Patel (@CryptoPatel) November 29, 2025 Ethereum marktstructuur richting einde van het jaar De combinatie van dalende exchange reserves, een bullish MACD crossover en duidelijke hogere bodems geeft Ethereum een steviger fundament dan enkele weken geleden. De technische zones rond $3.058 en $3.600 blijven belangrijk, omdat de ETH grafiek daar eerder sterke reacties liet zien. Wanneer de bulls deze prijszones blijven verdedigen, blijft het scenario voor een verdere opwaartse koersbeweging richting een afgerond gebied rond $4.200 overeind. De upgrade planning en de huidige momentumstructuur ondersteunen dit beeld, zonder dat er sprake is van speculatieve aannames. Ethereum beweegt hiermee in een fase waarin de technische opbouw en supplydynamiek elkaar versterken. Best wallet - betrouwbare en anonieme wallet Best wallet - betrouwbare en anonieme wallet Meer dan 60 chains beschikbaar voor alle crypto Vroege toegang tot nieuwe projecten Hoge staking belongingen Lage transactiekosten Best wallet review Koop nu via Best Wallet Let op: cryptocurrency is een zeer volatiele en ongereguleerde investering. Doe je eigen onderzoek. Het bericht Ethereum koers richting $4.500 door 55% Pectra effect en herstel huidige structuur? is geschreven door Dirk van Haaster en verscheen als eerst op Bitcoinmagazine.nl.
Share
Author: Coinstats2025/12/01 03:16
Most ETH Valuation Models Indicate Undervaluation, Though One Signals Overpricing
The post Most ETH Valuation Models Indicate Undervaluation, Though One Signals Overpricing appeared on BitcoinEthereumNews.com. Ethereum valuation models largely indicate that ETH is undervalued at current prices around $3,000, with a composite fair value of $4,836 suggesting over 58% upside potential, though one key model warns of overvaluation by 57% due to declining network revenue. Nine out of 12 models rate ETH as undervalued, pointing to strong growth prospects based on on-chain activity and network metrics. Models like App Capital and Metcalfe’s Law project fair values up to $9,484, highlighting Ethereum’s expanding ecosystem. Despite optimism, the Revenue Yield model values ETH at $1,296, citing record-low fees and competition from other blockchains, with data from ETHval analysis. Discover why Ethereum valuation models show ETH as mostly undervalued at $3,000, with fair value estimates up to $9,484. Explore key insights and one contrarian view in this analysis. Stay informed on crypto trends today. What Do Ethereum Valuation Models Say About ETH’s Current Price? Ethereum valuation models predominantly suggest that Ether (ETH) remains undervalued at its current market price just above $3,000, with most projections indicating significant room for growth. According to analysis from CryptoQuant CEO Ki Young Ju, nine out of 12 established models position ETH below its fair value, driven by robust on-chain metrics and network expansion. A composite fair value across these models estimates ETH at approximately $4,836, representing more than a 58% increase from recent levels, underscoring Ethereum’s foundational role in decentralized finance. 12 different ETH valuation models signal that ETH is undervalued at current market prices just north of $3,000. Source: ETHval The native token of the Ethereum network, Ether (ETH), powers the world’s leading smart contract platform, facilitating everything from decentralized applications to tokenization of real-world assets. These valuation models draw from diverse methodologies, including on-chain data, network growth theories, and economic indicators, to assess ETH’s intrinsic worth. Ki Young Ju, a…
Share
Author: BitcoinEthereumNews2025/12/01 02:27

ETH Reclaims $3,000, Is a Bigger Breakout Coming?
The post ETH Reclaims $3,000, Is a Bigger Breakout Coming? appeared on BitcoinEthereumNews.com. $Ethereum is trading around $3,030, regaining the key $3,000 psychological level after a decisive rebound from support. Renewed ETF inflows, rising whale accumulation, and improving technical momentum all contributed to the bounce. With ETH now consolidating just below major resistance, traders are watching whether it can trigger a breakout toward higher levels. Below is the full breakdown of why $ETH is up — and where the price could go next based on the chart. Why Ethereum Price Is Up 1. ETF Demand Returns (Bullish Impact) Overview After facing $1.4B in net outflows through November, Ethereum ETFs flipped positive with $368M in inflows during the final week. This shift aligned with reduced geopolitical tension and ETH’s prolonged underperformance compared to Bitcoin. What This Means Institutions appear to be rotating back into ETH, treating it as a catch-up play. ETF inflows decrease sell pressure and act as confirmation that the $3,000 support area is fundamentally backed by institutional demand. Watch For Whether inflows continue into early December If ETH ETF demand outpaces BTC for the first time in weeks 2. Whale & Derivatives Activity (Mixed Impact) Overview On-chain data shows whales added 14,618 ETH (~$185M) in late November. At the same time, ETH derivatives open interest rose $700M, with longs dominating shorts 2:1 near $2,960. What This Means Large players are aggressively defending the $2,960–$3,000 zone. However, rising leverage — 3.97M open contracts — introduces liquidation risks if ETH fails to break above $3,100 resistance. Watch For Long liquidations if ETH rejects at $3,100–$3,200 Leverage resets that could trigger either volatility spike 3. Technical Momentum (Bullish Short-Term) Overview ETH has reclaimed the 20-day EMA ($2,968) and printed a bullish MACD crossover with a strong histogram at +37.73. The zone between $2,960 and $3,000 now acts as confirmed support. What This Means If…
Share
Author: BitcoinEthereumNews2025/12/01 02:00

Ethereum Whales And Binance Signal Potential Price Rally
Crypto market analysis currently shows a critical divergence in on-chain data, indicating strong potential for a significant upside move. Recent findings confirm that influential Ethereum Whales are aggressively accumulating ETH, which pushed their total holdings to a historic high. Simultaneously, Binance has seen ETH reserves plummeting, while stablecoin reserves surged to a new record. Historic Accumulation by Ethereum Whales Ethereum’s most influential market participants have shifted their strategy toward aggressive long-term accumulation. Data identifies holders with balances between 10,000 and 100,000 ETH as the primary drivers of this trend. The influential group recently pushed their total balance past 21 million ETH, setting a new record and a strong accumulation wave. Mid-cap whales used recent months to increase their holdings. Such a demographic often acts as a leading indicator for broader market trends. Their refusal to sell, combined with active buying, establishes a high-conviction floor for the asset. Confidence extends beyond the mid-cap tier to the largest entities in the ecosystem. The “mega-whale” cohort, defined as addresses holding more than 100,000 ETH, has expanded its balance to approximately 4.3 million ETH. This rise reflects a decisive shift in sentiment among institutional and highly liquid investors. In the past, when these huge groups buy, it comes before a strong price support level. These bases often act as starting points for big market rallies as the investors see current prices as a good deal. By locking away millions of ETH, they cut the supply available for trading. Both mid-cap whales and mega-whales increased their ETH holdings. – Source: CryptoQuant Learn more: NFTPlazas Guide: Ethereum Blockchain Fundamental Falling Binance Reserves, Record Stablecoin Inflows Data from Binance, the world’s largest exchange, backs up the bullish idea. Since August 15th, the exchange has seen a big difference in money flows. In just a few months, Ethereum reserves on Binance nearly dropped by half. The total value fell from over 20 billion to under 11 billion. The actual number of Ethereum tokens dropped to 3.764 million ETH in November. Investors clearly prefer cold storage or staking instead of keeping assets on exchanges. While volatile assets leave exchanges, stablecoins are flooding in. The inflow creates a strong opposite trend. Tether (USDT) reserves across TRC20 and ERC20 networks on Binance surged from 26 billion to a record-breaking 42 billion. This metric serves as the key to understanding the current market sentiment. Traders have taken profits during previous peaks but have not exited the crypto ecosystem. Instead of leaving, they put cash into stablecoins right on the exchange. The USDT setup shows that traders are not bearish; they are waiting for the right moment. Binance reserves show decreasing ETH supply while stablecoins surged. – Source: CryptoQuant What Comes Next? The data mix creates a “coiled spring” effect in the market. Two strong forces now meet: a dropping supply of assets for sale (BTC and ETH) and an all-time high in buying power (USDT reserves). Market players currently show “armed patience.” Investors wait for a specific sign, such as a price dip or better economic news, to use this money. When this cash floods the market, it chases a small supply of coins. Thus, the on-chain signs give a clear outlook: The market looks quiet but holds lots of cash. Whales act with conviction by removing supply, while traders stand ready with record levels of stablecoin capital. This structure typically precedes significant market volatility favoring the upside. As the supply of Ethereum and Bitcoin disappears into cold storage, the $42 billion in stablecoin reserves will likely fuel the next big market growth. The post Ethereum Whales And Binance Signal Potential Price Rally appeared first on NFT Plazas.
Share
Author: Coinstats2025/12/01 01:48