

How to Use Golden Cross and Death Cross Signals in Trading: A Complete Beginner's Guide
Key Takeaways:
- A golden cross forms when a short-term moving average crosses above a long-term moving average and is commonly interpreted as a potential bullish signal. A death cross forms when the short-term moving average crosses below the long-term moving average and is commonly interpreted as a potential bearish signal.
- The most widely recognized combination uses the 50-day and 200-day simple moving averages. Golden and death crosses can be applied to stocks, foreign exchange, cryptocurrencies, and other markets.
- Golden and death crosses are lagging signals. They reflect changes that have already occurred in historical price averages rather than predicting future price movements.
- Traders can combine these crossover signals with trading volume, the Relative Strength Index (RSI), and other tools to obtain additional confirmation and help filter false signals.
- Users can add moving averages to candlestick charts on MEXC and monitor the formation of golden and death crosses.
1. What Are Golden Cross and Death Cross Signals?
Golden and death crosses are among the most widely recognized moving average crossover signals in technical analysis. Traders commonly use them to identify potential changes in market trends.
A golden cross occurs when a short-term moving average, usually the 50-day moving average, crosses above a long-term moving average, usually the 200-day moving average. This indicates that the average price over the shorter period has risen above the average price over the longer period. Traders commonly interpret this crossover as a potential bullish signal.
A death cross is the opposite formation. It occurs when a short-term moving average crosses below a long-term moving average. This indicates that the average price over the shorter period has fallen below the average price over the longer period. Traders commonly interpret this crossover as a potential bearish signal.
The same underlying principle applies across cryptocurrency, equity, commodity, and other markets. On MEXC, users can add moving average indicators to the chart of a selected trading pair to identify these two crossover patterns.
2. Moving Averages: The Basis of Golden and Death Crosses
A moving average smooths price fluctuations by calculating the average price over a specified period. For example, a 50-day simple moving average represents the average closing price over the previous 50 trading days. When a new trading day is added, the oldest data point is removed from the calculation.
Two common types of moving averages are:
- Simple Moving Average (SMA): Assigns equal weight to each price within the calculation period, generally producing a smoother line.
- Exponential Moving Average (EMA): Assigns greater weight to recent prices and responds more quickly to price changes.
A short-term moving average uses fewer historical observations and therefore responds more quickly to recent price movements. A long-term moving average uses more observations, responds more slowly, and reflects the average price over a longer period. Changes in the relative positions of the two averages produce golden and death cross signals.
3. How Golden and Death Crosses Form
Golden and death crosses usually develop gradually as as new price data is incorporated into the moving average calculations.
A golden cross commonly develops through three stages:
1)Downtrend or consolidation: The short-term moving average remains below the long-term moving average, meaning that the average price over the shorter period is lower than the average price over the longer period.
2)Convergence: As recent prices strengthen, the short-term moving average begins to rise and moves closer to the long-term moving average.
3)Crossover confirmation: The short-term moving average crosses above the long-term moving average, completing the golden cross.
A death cross develops through the opposite process. The short-term moving average initially remains above the long-term moving average. As recent prices weaken, the two averages converge, and the death cross forms when the short-term moving average crosses below the long-term moving average.
When traders use longer calculation periods, such as the 50-day and 200-day moving averages, the formation process may take several weeks or months.
4. How to Use a Golden Cross in Trading
When a golden cross appears, traders may consider the following approaches:
- Assess a potential entry: Traders may use the golden cross as one indication that the price trend could be shifting upward before considering a long position.
- Check trading volume: An increase in trading volume around the crossover may provide additional evidence of market participation. A golden cross formed on relatively low volume may warrant further confirmation.
- Combine it with other indicators: Traders can use the RSI to assess whether the market is already overbought or the price has become excessively extended.
- Choose an appropriate timeframe: Daily and weekly charts generally contain less short-term noise than minute-based charts. Shorter timeframes tend to produce more frequent crossovers and may generate more false signals.
A golden cross is not an unconditional instruction to buy. It should be used as one of several factors when evaluating market conditions.
5. How to Use a Death Cross for Risk Management
Immediately selling or opening a short position after a death cross also involves risk. Traders may instead consider the following approaches:
- Reassess existing positions: A death cross can serve as a reminder to review current positions and determine whether stop-loss levels or overall risk exposure should be adjusted.
- Monitor potential rebounds: A sharp decline may be followed by a short-term technical rebound. If the rebound fails near the long-term moving average and the price subsequently declines, some traders may view this as additional bearish confirmation.
- Control position size: Traders can use appropriate stop-loss levels and conservative position sizing to limit potential losses if the death cross becomes a false signal.
In some market cycles, prices may stabilize or rebound after a death cross forms. Because moving averages lag behind price, the crossover may not appear until a substantial part of the decline has already occurred. A death cross should therefore not be treated as an automatic sell or short signal.
6. Limitations of Golden and Death Crosses
Lagging signals: Moving averages are calculated entirely from historical prices. By the time a crossover forms, a substantial part of the price movement may already have occurred, potentially resulting in a less favorable entry or risk-reward profile.
False signals and repeated crossovers: In sideways, low-volume, or highly volatile markets, moving averages may cross repeatedly. This can result in whipsaw signals, with frequent entries, exits, and losses.
No predictive certainty: Golden and death crosses describe changes in historical price averages and cannot guarantee future market direction. The performance of a moving average crossover strategy depends on the asset, timeframe, selected parameters, market conditions, trading rules, and transaction costs. In some periods, a crossover strategy may underperform a long-term holding strategy.
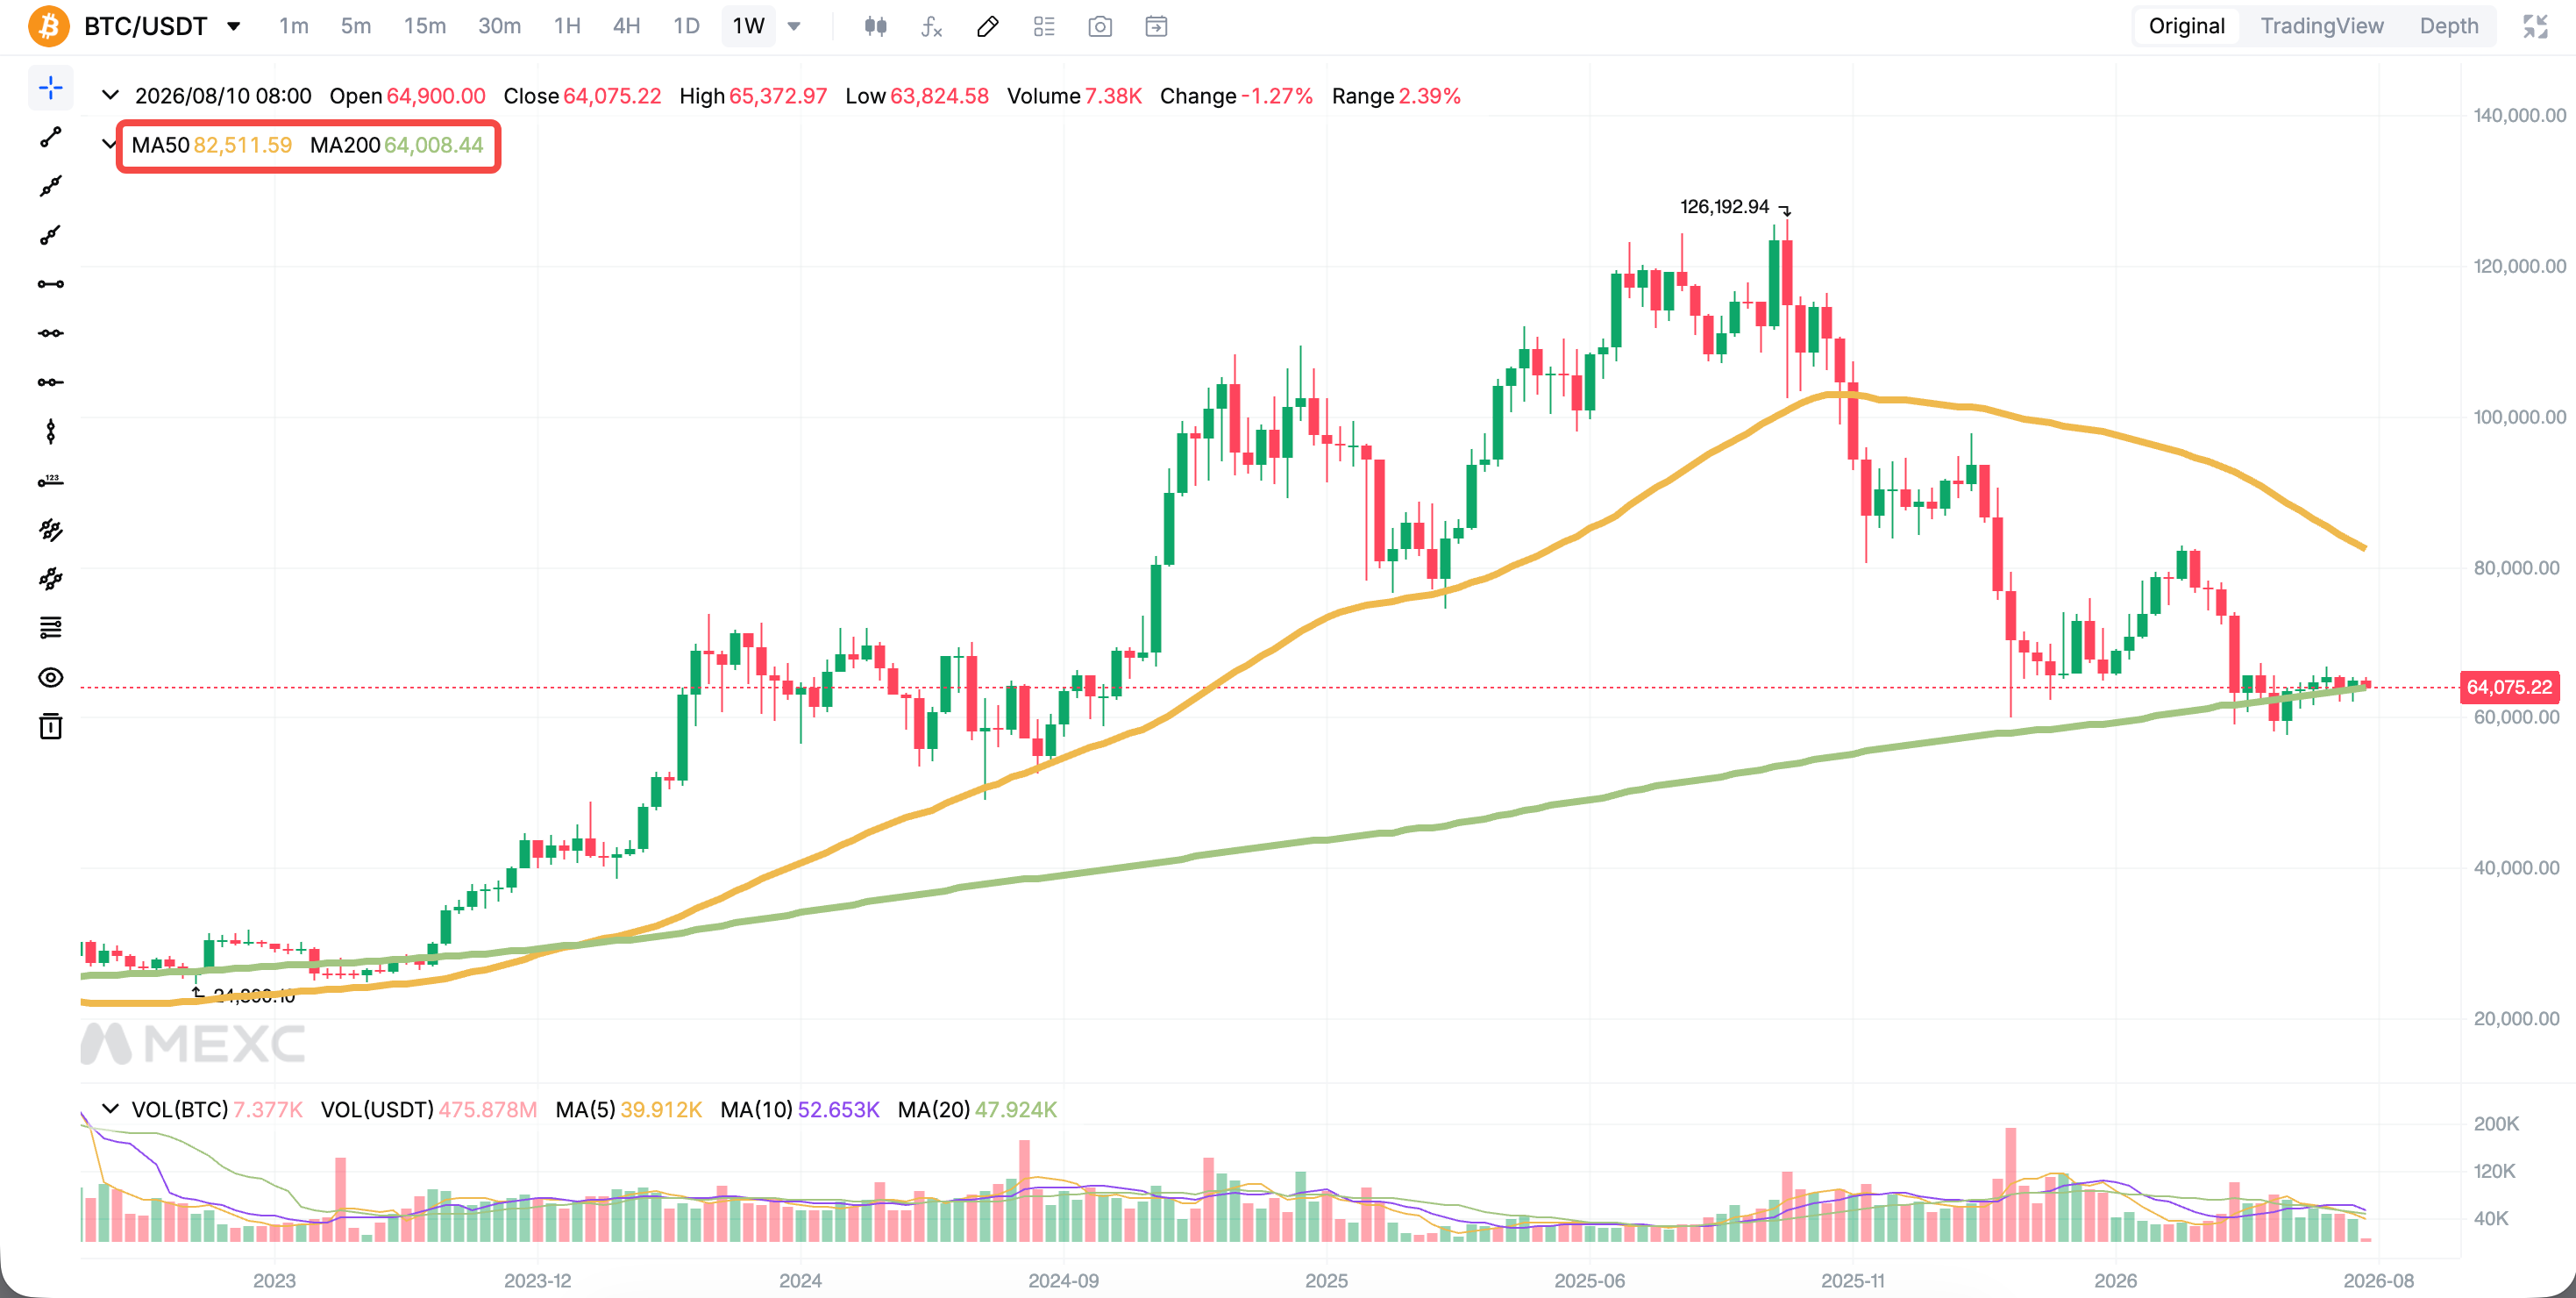
7. How to Apply a Golden Cross and Death Cross Strategy on MEXC
MEXC provides charting tools that allow users to apply a moving average crossover strategy:
- Open the candlestick chart for the selected trading pair and switch to the daily or weekly timeframe.
- Add two simple moving average indicators and set their periods to 50 and 200.
- Observe the relative positions of the two moving averages and whether the distance between them is narrowing.
- Combine the crossover with trading volume, RSI, and other analytical tools.
- Establish clear entry, stop-loss, and take-profit rules before executing a trade.
Beginners may consider testing the approach with small positions while gradually building experience and prioritizing risk management.
8. Golden Cross and Death Cross FAQ
8.1 How do you use a golden cross in trading?
After a golden cross appears, traders may examine whether trading volume has increased, whether the market is already overbought, and whether the price can remain above the long-term moving average.
Because the crossover is based on historical prices, traders should avoid treating it as an automatic instruction to buy. A more cautious approach is to use the golden cross as one of several analytical signals and apply appropriate stop-loss rules.
8.2 What do golden and death crosses indicate?
A golden cross indicates that the average price over a shorter period has moved above the average price over a longer period. Traders commonly interpret this crossover as a potential bullish signal.
A death cross indicates that the average price over a shorter period has moved below the average price over a longer period. Traders commonly interpret this crossover as a potential bearish signal.
Both signals reflect changes that have already occurred in historical price averages rather than predicting future price movements.
8.3 Is a golden cross always bullish?
No. Although a golden cross is commonly interpreted as a bullish signal, it does not guarantee that the price will continue rising.
Because moving averages are lagging indicators, the price may have already risen substantially by the time the crossover forms. A correction or period of consolidation may follow. Golden crosses may also generate false signals in sideways markets.
8.4 Can prices rise after a death cross?
Yes. Because moving averages respond to price changes with a delay, a death cross may not form until a substantial part of the decline has already occurred. The market may subsequently stabilize or rebound. A death cross should therefore not be interpreted simply as an instruction to sell.
8.5 Which moving averages are commonly used for golden crosses?
The most widely recognized combination is the 50-day and 200-day simple moving averages.
Short-term traders may use moving averages with shorter calculation periods to obtain more responsive signals. However, shorter periods generally produce more frequent crossovers and may also generate more false signals.
8.6 How effective is a golden cross strategy?
There is no universal success rate. Results depend on the asset, timeframe, selected moving average periods, market environment, trading rules, and transaction costs.
Golden cross strategies may perform better during sustained trends and may produce more false signals in sideways markets. Their long-term performance does not necessarily exceed that of a simple holding strategy, so a golden cross is generally better used as a supporting signal than as a standalone trading system
8.7 Which is more important, a golden cross or a death cross?
Neither signal is inherently more important. Their relevance depends on the trader's strategy and current position.
A golden cross may help identify a potential entry opportunity, while a death cross may prompt traders to review their positions and manage downside risk. Both should be evaluated alongside market conditions, price action, and risk-management rules.
Recommended Reading
Risk Disclaimer: This content is for educational and informational purposes only and does not constitute financial, investment, or trading advice. Technical indicators are based on historical market data and cannot predict or guarantee future market performance. Digital asset trading involves significant risk and price volatility. Always conduct your own research and assess your risk tolerance before making any trading decisions.