Buy Crypto
Markets
Spot
FuturesBTC
Earn
Event Center
Rewards Hub
More
How to Use TradingView on MEXC: A Complete Guide to Charting ToolsHow to Use TradingView on MEXC: A Complete Guide to Charting Tools
Category List
Cancel

How to Use TradingView on MEXC: A Complete Guide to Charting Tools

Key Takeaways:

  • TradingView is a powerful market charting and trading analysis tool integrated into MEXC's Spot and Futures trading pages, where you can use it directly for free.
  • This article explains how to customize TradingView candlestick styles, colors, and display settings on MEXC.
  • Learn how to use drawing tools and add, adjust, and remove technical indicators.
  • Find step-by-step instructions for personalizing the chart's time zone, labels, and background.
  • Learn how to reset the chart in one click and find answers to common questions for beginners.

1. What Is TradingView?


TradingView is a powerful market charting and trading analysis tool. It provides real-time market data, professional charting tools, and a wide range of technical indicators to tens of millions of traders and investors worldwide. Designed for users of all experience levels, TradingView helps beginners and experienced traders alike analyze market trends more intuitively.

MEXC has integrated TradingView's charting tools into its platform. There is no need to register separately for or download TradingView. Simply open a MEXC Spot or Futures trading page to access all its core charting features directly for free.

2. How to Customize TradingView Candlestick Charts on MEXC


Candlestick charts, also known as K-line charts, typically use solid candles by default, with green indicating price increases and red indicating price decreases. In some regions, red is used for increases and blue for decreases.

On the MEXC trading page, hover over the Chart icon to view eight chart styles. Click a style to switch to it.
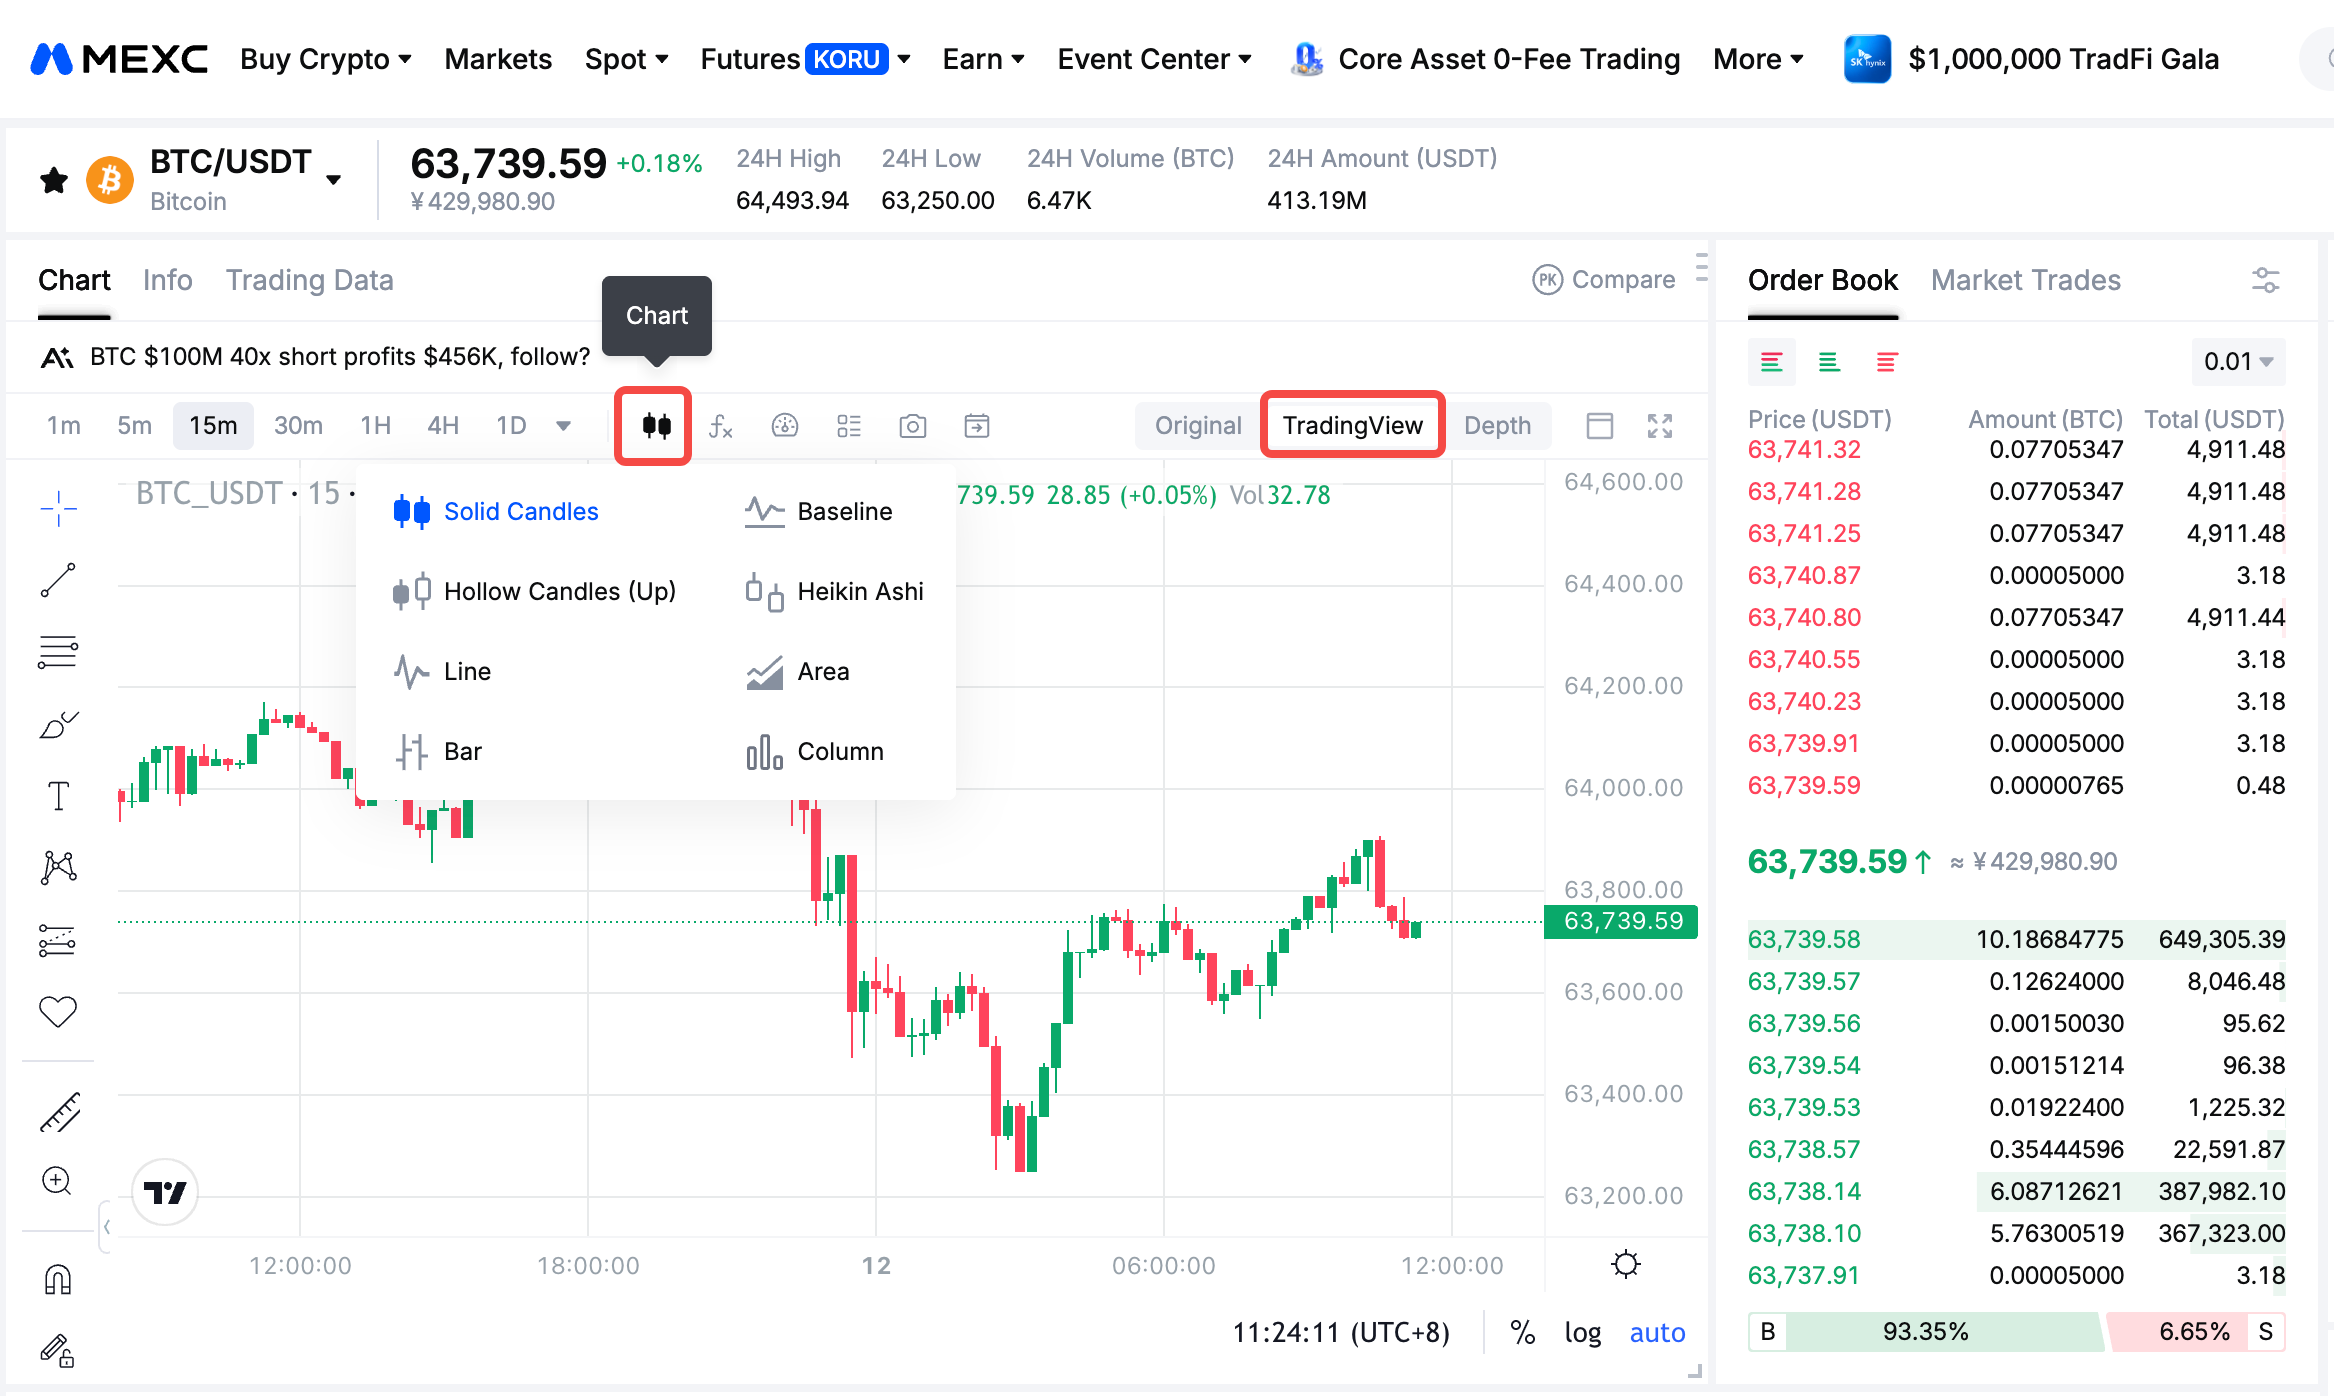


For more customization options, click the chart settings icon above the candlestick chart to open Chart settings. In the first tab, Symbol, you can adjust candle colors, price line colors, the time zone, and other settings.


3. How to Use TradingView Drawing Tools


The toolbar beside the chart provides common drawing tools, including trend lines, horizontal lines, and Fibonacci retracement. These tools help you mark key price levels and analyze market trends.

To use a drawing tool, click its icon in the side toolbar, then draw directly on the candlestick chart. The process is straightforward, even for beginners.


4. How to Add Technical Indicators on TradingView


For more experienced traders, technical indicators are important tools for analyzing market trends. To add an indicator to a TradingView chart on MEXC:

1. Click the technical indicators button above the candlestick chart.

2. Scroll through the Indicators list or search for an indicator by name.

3. Click the indicator to add it to the chart.


After adding an indicator, you can adjust its parameters and style to suit your preferences. For example, to customize Bollinger Bands (BB), click the indicator on the candlestick chart, then click the gear icon above it to open its settings. Make your changes, then click Ok to apply them.

Click the eye icon to show or hide an indicator, or click X to remove it from the chart.


5. How to Change the TradingView Chart Time Zone


Click the time zone information below the candlestick chart to change the chart's time zone. All statistical values remain unchanged; only the displayed date and time change.


6. TradingView Chart Settings


Click the chart settings icon above the candlestick chart to open Chart settings. The four tabs, from top to bottom, are:

  • Symbol: Customize candle colors, price line colors, precision, and the time zone.
  • Status line: Choose which information appears at the top of the chart, including open, high, low, and close prices, candle price changes, and trading volume.
  • Scales: Configure labels for the symbol name, high and low prices, and the countdown to the candle close.
  • Appearance: Customize the chart's background color, grid line colors, and other visual settings.


7. How to Reset the TradingView Chart


To clear your chart customizations and restore the default settings, right-click the candlestick chart and select Reset chart view.


8. TradingView FAQ


8.1 What is TradingView?


TradingView is a professional market charting and trading analysis tool that provides real-time market data, charting tools, and hundreds of technical indicators. It is widely used by traders around the world.

8.2 Is TradingView free to use on MEXC?


Yes. MEXC has integrated TradingView's charting tools into its platform, and all users can access them for free on the Spot and Futures trading pages.

8.3 Do I need a separate account to use TradingView on MEXC?


No. Simply log in to your MEXC account and open a trading page. No additional registration or software download is required.

8.4 Which technical indicators are commonly used on TradingView?


Common indicators include moving averages, Bollinger Bands, the Relative Strength Index (RSI), and Moving Average Convergence Divergence (MACD). You can search for and add them from the Indicators list on MEXC.

8.5 Can I change the candlestick colors on TradingView?


Yes. Open Chart settings and go to Symbol to customize the colors for rising and falling candles, price lines, and more.

8.6 Are the TradingView settings the same on the Futures trading page?


Yes. TradingView charts on MEXC's Futures trading page use the same settings as those on the Spot trading page.

8.7 How do I restore the default chart settings?


Right-click the candlestick chart and select Reset chart view to clear all customizations and restore the default settings.


How to Use TradingView on MEXC: A Complete Guide to Charting Tools

Key Takeaways:

  • TradingView is a powerful market charting and trading analysis tool integrated into MEXC's Spot and Futures trading pages, where you can use it directly for free.
  • This article explains how to customize TradingView candlestick styles, colors, and display settings on MEXC.
  • Learn how to use drawing tools and add, adjust, and remove technical indicators.
  • Find step-by-step instructions for personalizing the chart's time zone, labels, and background.
  • Learn how to reset the chart in one click and find answers to common questions for beginners.

1. What Is TradingView?


TradingView is a powerful market charting and trading analysis tool. It provides real-time market data, professional charting tools, and a wide range of technical indicators to tens of millions of traders and investors worldwide. Designed for users of all experience levels, TradingView helps beginners and experienced traders alike analyze market trends more intuitively.

MEXC has integrated TradingView's charting tools into its platform. There is no need to register separately for or download TradingView. Simply open a MEXC Spot or Futures trading page to access all its core charting features directly for free.

2. How to Customize TradingView Candlestick Charts on MEXC


Candlestick charts, also known as K-line charts, typically use solid candles by default, with green indicating price increases and red indicating price decreases. In some regions, red is used for increases and blue for decreases.

On the MEXC trading page, hover over the Chart icon to view eight chart styles. Click a style to switch to it.


For more customization options, click the chart settings icon above the candlestick chart to open Chart settings. In the first tab, Symbol, you can adjust candle colors, price line colors, the time zone, and other settings.


3. How to Use TradingView Drawing Tools


The toolbar beside the chart provides common drawing tools, including trend lines, horizontal lines, and Fibonacci retracement. These tools help you mark key price levels and analyze market trends.

To use a drawing tool, click its icon in the side toolbar, then draw directly on the candlestick chart. The process is straightforward, even for beginners.


4. How to Add Technical Indicators on TradingView


For more experienced traders, technical indicators are important tools for analyzing market trends. To add an indicator to a TradingView chart on MEXC:

1. Click the technical indicators button above the candlestick chart.

2. Scroll through the Indicators list or search for an indicator by name.

3. Click the indicator to add it to the chart.


After adding an indicator, you can adjust its parameters and style to suit your preferences. For example, to customize Bollinger Bands (BB), click the indicator on the candlestick chart, then click the gear icon above it to open its settings. Make your changes, then click Ok to apply them.

Click the eye icon to show or hide an indicator, or click X to remove it from the chart.


5. How to Change the TradingView Chart Time Zone


Click the time zone information below the candlestick chart to change the chart's time zone. All statistical values remain unchanged; only the displayed date and time change.


6. TradingView Chart Settings


Click the chart settings icon above the candlestick chart to open Chart settings. The four tabs, from top to bottom, are:

  • Symbol: Customize candle colors, price line colors, precision, and the time zone.
  • Status line: Choose which information appears at the top of the chart, including open, high, low, and close prices, candle price changes, and trading volume.
  • Scales: Configure labels for the symbol name, high and low prices, and the countdown to the candle close.
  • Appearance: Customize the chart's background color, grid line colors, and other visual settings.


7. How to Reset the TradingView Chart


To clear your chart customizations and restore the default settings, right-click the candlestick chart and select Reset chart view.


8. TradingView FAQ


8.1 What is TradingView?


TradingView is a professional market charting and trading analysis tool that provides real-time market data, charting tools, and hundreds of technical indicators. It is widely used by traders around the world.

8.2 Is TradingView free to use on MEXC?


Yes. MEXC has integrated TradingView's charting tools into its platform, and all users can access them for free on the Spot and Futures trading pages.

8.3 Do I need a separate account to use TradingView on MEXC?


No. Simply log in to your MEXC account and open a trading page. No additional registration or software download is required.

8.4 Which technical indicators are commonly used on TradingView?


Common indicators include moving averages, Bollinger Bands, the Relative Strength Index (RSI), and Moving Average Convergence Divergence (MACD). You can search for and add them from the Indicators list on MEXC.

8.5 Can I change the candlestick colors on TradingView?


Yes. Open Chart settings and go to Symbol to customize the colors for rising and falling candles, price lines, and more.

8.6 Are the TradingView settings the same on the Futures trading page?


Yes. TradingView charts on MEXC's Futures trading page use the same settings as those on the Spot trading page.

8.7 How do I restore the default chart settings?


Right-click the candlestick chart and select Reset chart view to clear all customizations and restore the default settings.