What is the MEXC Market Movers Board?
1. What is the Market Movers Board?
Status Type | Time-Frame | Condition | |
New High | Today High | 24 hours | The highest price in the past 1 minute equals today's / this week's / this month's highest price.
Update Frequency: Every 1 minute |
Weekly High | 24×7 hours | ||
Monthly High | 24×30 hours | ||
Price Up | 5m Tick | Within 5 minutes | Token price increase 3% ≤ rise < 7%.
Update Frequency: Every 1 minute |
2H Tick | Within 2 hours | ||
5m Rise | Within 5 minutes | Token price increase 7% ≤ rise < 11%.
Update Frequency: Every 1 minute | |
2H Rise | Within 2 hours | ||
5m Surge | Within 5 minutes | Token price increase ≥ 11%.
Update Frequency: Every 1 minute | |
2H Surge | Within 2 hours | ||
New Low | Today Low | 24 hours | The lowest price in the past 1 minute equals today's / this week's / this month's lowest price.
Update Frequency: Every 1 minute |
Weekly Low | 24×7 hours | ||
Monthly Low | 24×30 hours | ||
Price Down | 5m Dip | Within 5 minutes | Token price decrease 3% ≤ drop < 7%.
Update Frequency: Every 1 minute |
2H Dip | Within 2 hours | ||
5m Drop | Within 5 minutes | Token price decrease 7% ≤ drop < 11%.
Update Frequency: Every 1 minute | |
2H Drop | Within 2 hours | ||
5m Plunge | Within 5 minutes | Token price decrease ≥ 11%.
Update Frequency: Every 1 minute | |
2H Plunge | Within 2 hours | ||
Pullback | Pullback | —— | (Daily High − Daily Open) / Daily Open ≥ 8% and (1-minute candlestick close − Daily High) / Daily High ≤ −5%.
Update Frequency: Every 1 minute |
Rally | Rally | —— | (Daily Low − Daily Open) / Daily Open ≤ −8% and (1-minute candlestick close − Daily Low) / Daily Low ≥ 5%.
Update Frequency: Every 1 minute |
Price Up & High Vol. | Tick, High Vol. | —— | 7% ≤ 15-minute price increase < 11% and 15-minute trading volume ≥ 50× the average of the past 24 fifteen-minute periods.
Update Frequency: Every 10 seconds |
Rise, High Vol. | —— | 11% ≤ 15-minute price increase < 15% and 15-minute trading volume ≥ 50× the average of the past 24 fifteen-minute periods.
Update Frequency: Every 10 seconds | |
Surge, High Vol. | —— | 15-minute price increase ≥ 15% and 15-minute trading volume ≥ 50× the average of the past 24 fifteen-minute periods.
Update Frequency: Every 10 seconds | |
Price Down & High Vol. | Dip, High Vol. | —— | 7% ≤ 15-minute price decrease < 11% and 15-minute trading volume ≥ 50× the average of the past 24 fifteen-minute periods.
Update Frequency: Every 10 seconds |
Drop, High Vol. | —— | 11% ≤ 15-minute price decrease < 15% and 15-minute trading volume ≥ 50× the average of the past 24 fifteen-minute periods.
Update Frequency: Every 10 seconds | |
Plunge, High Vol. | —— | 15-minute price decrease ≥ 15% and 15-minute trading volume ≥ 50× the average of the past 24 fifteen-minute periods.
Update Frequency: Every 10 seconds |
2. How to Access the Market Movers Board
2.1 Web
2.2 App

Popular Articles
View More
Oura Competitors: Samsung, Apple and the Smart Ring Market
Oura's competitors fall into three groups, according to its IPO prospectus: smartwatch makers such as Apple, Google and Samsung; fitness wearables such as Garmin, Coros and Whoop; and software-only
Is Oura Profitable? Revenue, Business Model and Valuation
Yes, Oura is profitable on a net income basis. Its IPO prospectus shows net income of $60.8 million on revenue of $1.21 billion in the nine months to June 30, 2026. The $924.3 million loss in some
Oura IPO 2026: Date, Price, Valuation and How to Trade OURA
Oura, the company behind the Oura Ring, is expected to price its U.S. initial public offering during the week of September 28, 2026 and list on the Nasdaq Global Select Market under the ticker OURA.
Trending News
View More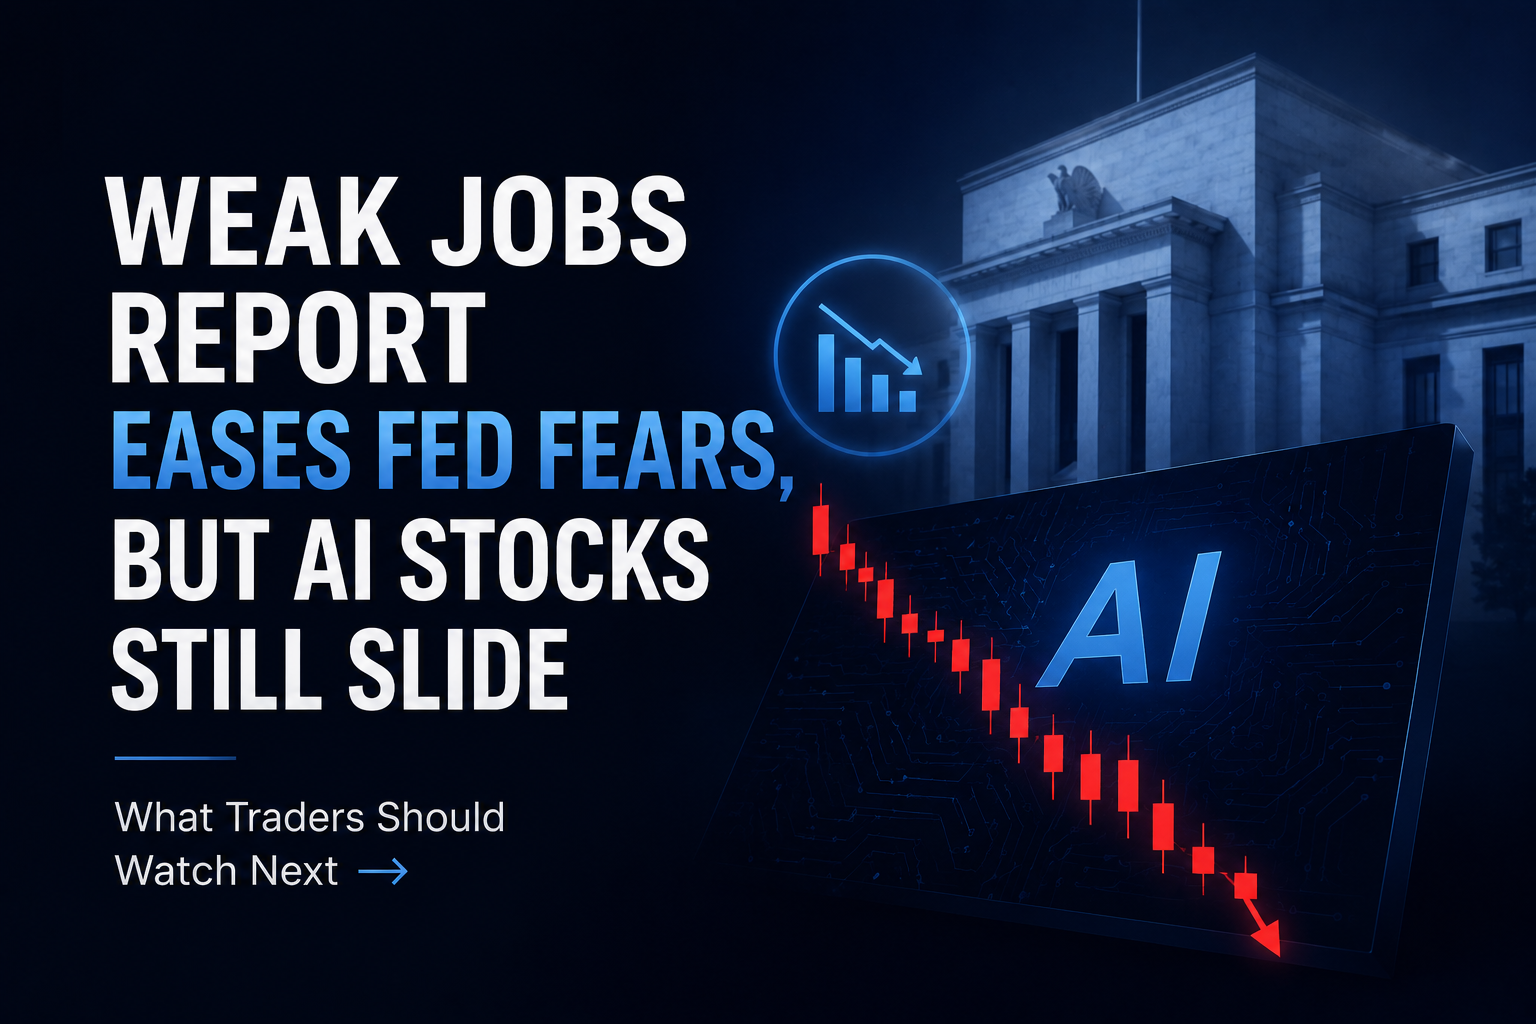
Weak Jobs Report Eases Fed Fears, But AI Stocks Still Slide: What Traders Should Watch Next
The U.S. June jobs report signaled a clear economic slowdown, missing expectations and lowering Federal Reserve rate hike fears. Despite lower Treasury yields, AI and tech stocks slid, proving that ma

2026 U.S. Midterm Elections: What Crypto Traders Should Watch
The 2026 U.S. midterm elections could reshape Congress, crypto regulation and fiscal policy. Here is what Bitcoin traders should monitor.

Related Articles
View More
The Complete Guide to Coin-M Perpetual Futures on MEXC
In cryptocurrency derivatives, Futures trading enables investors to apply leverage to increase potential returns and to take positions in both rising and falling markets. MEXC offers two primary types
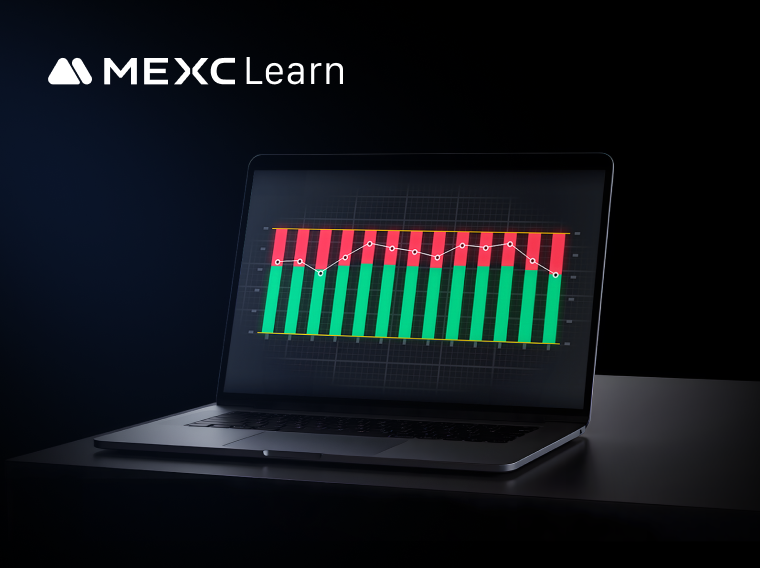
What Is the Long/Short Ratio? How to View Long/Short Ratio Data in Futures Trading?
BSL refers to long/short closing data. Currently, on the MEXC platform, both candlestick charts and line charts in Futures trading support the display of historical order data for long/short ratios. I

Why Choose MEXC Futures?
Cryptocurrency futures trading has attracted countless investors with its promise of high leverage and high returns. Choosing the right exchange is the first step on the journey to successful futures