क्रिप्टो खरीदें
मार्केट
स्पॉट
फ़्यूचर्सBTC
कमाएँ
इवेंट सेंटर
रिवॉर्ड हब
अधिक
How to Use Ease of Movement (EMV) in Trading: A Complete Beginner's GuideHow to Use Ease of Movement (EMV) in Trading: A Complete Beginner's Guide
कैटेगरी की लिस्ट
कैंसिल करें

How to Use Ease of Movement (EMV) in Trading: A Complete Beginner's Guide

Key Takeaways

  • Ease of Movement is a volume-based oscillator that measures how easily prices move by combining price and volume data.
  • A positive EMV value indicates that prices are moving upward with relatively little resistance, while a negative value suggests that prices are moving downward with relative ease.
  • Traders can use EMV to assess trends, identify zero-line crossover signals, and analyze divergences.
  • EMV should not be used on its own. Combine it with tools such as moving averages and the Relative Strength Index (RSI) to confirm signals.
  • On MEXC, you can add EMV to the candlestick chart to support your digital asset trading decisions.

1. What Is Ease of Movement?


Ease of Movement (EMV), also known as the Ease of Movement indicator, is a volume-based oscillator developed by technical analysis pioneer Richard W. Arms Jr. EMV fluctuates above and below the zero line. Its primary purpose is to quantify the relationship between price and volume and measure how easily prices move.

When prices rise significantly relative to trading volume, EMV tends to produce a positive value, indicating relatively easy upward price movement. Conversely, when prices fall significantly relative to trading volume, EMV tends to produce a negative value, indicating relatively easy downward price movement. If prices move only slightly despite high volume, price movement is difficult and EMV tends to remain near zero.

2. How to Use Ease of Movement in Trading


2.1 Determine trend direction and strength


When the indicator line is above the zero line, prices are moving upward with relative ease, indicating a bullish trend. The higher the value, the stronger the upward trend.

When the indicator line is below the zero line, prices are moving downward with relative ease, indicating a bearish trend. The lower the value, the stronger the downward trend.

2.2 Use zero-line crossover signals


The zero line is the key dividing line for EMV:

  • Potential buy signal: When EMV crosses above the zero line from negative territory, it may signal the start of an uptrend and a potential long opportunity.
  • Potential sell signal: When EMV crosses below the zero line from positive territory, it may signal the start of a downtrend, suggesting that traders consider reducing exposure or managing risk.

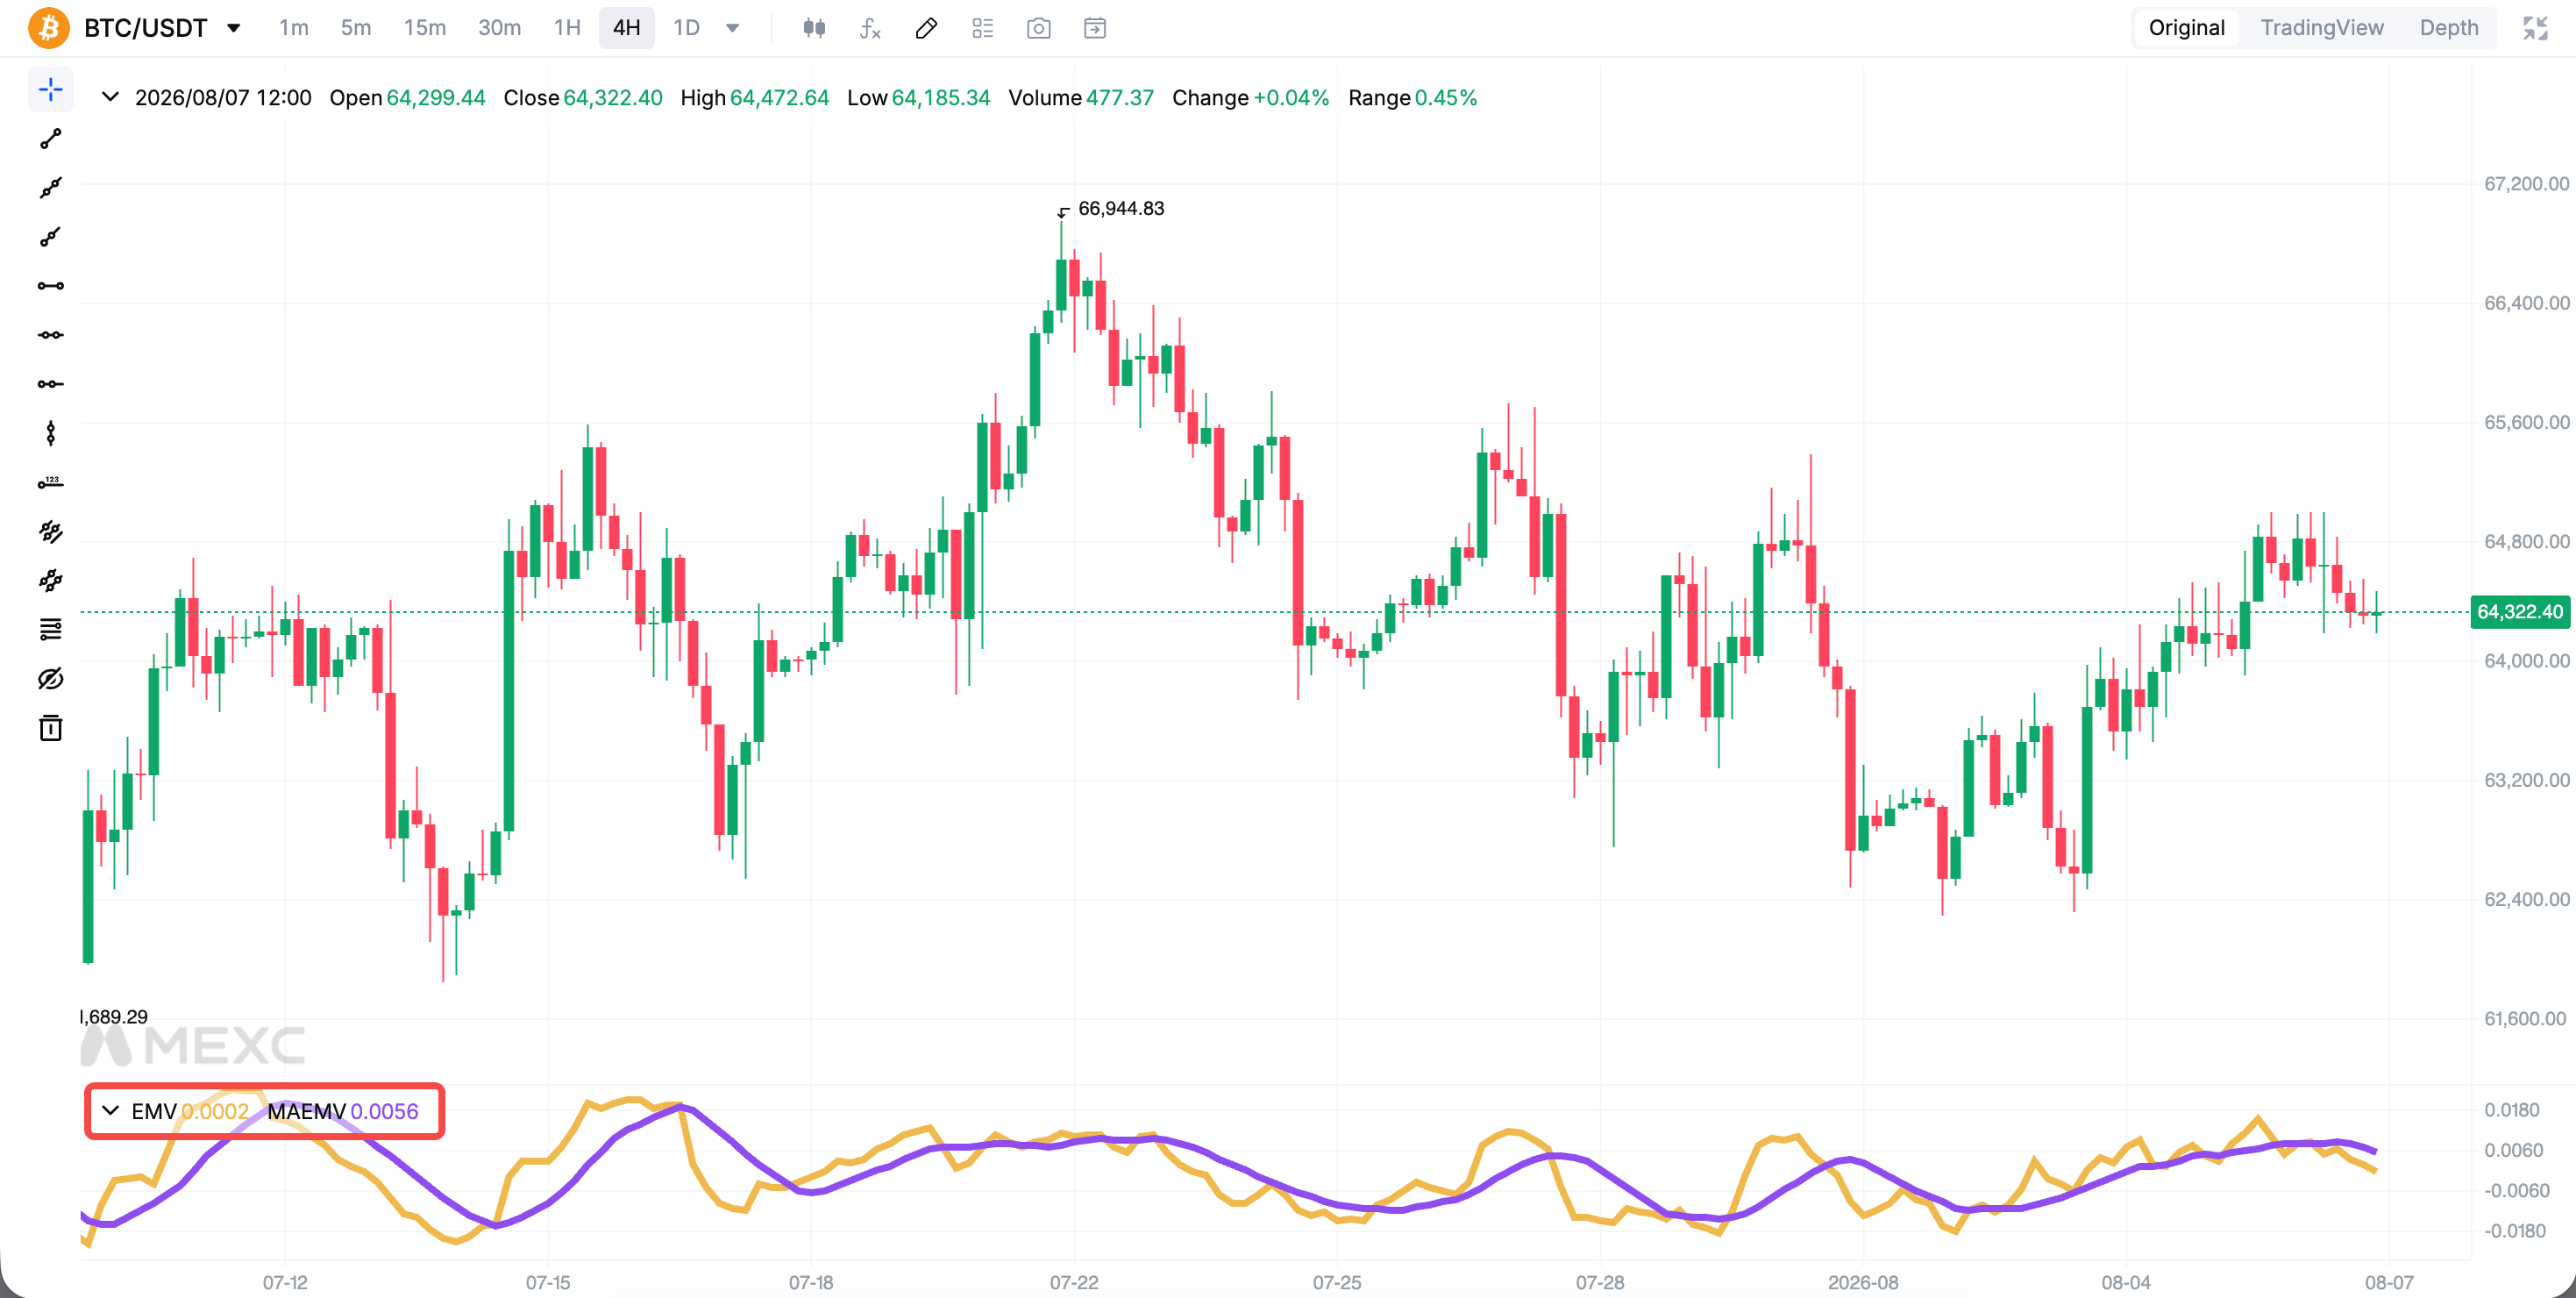
In the charting tools on MEXC, you can clearly track EMV crossovers around the zero line and evaluate them alongside price action.

2.3 Identify divergence signals


Divergence can help traders identify potential reversals:

  • Bullish divergence: The price makes a lower low while EMV forms a higher low. This suggests that selling pressure is weakening a potential bullish reversal may take shape.
  • Bearish divergence: The price makes a higher high while EMV forms a lower high. This suggests that upward momentum is weakening and a potential bearish reversal may take shape.

2.4 Use EMV with other indicators for confirmation


EMV is not a standalone trading system. It is most effective when used to confirm other signals:

1) Combine EMV with volume: A crossover above the zero line accompanied by rising volume can make a breakout signal more reliable. Treat EMV signals during low-volume periods with caution.

2) Combine EMV with moving averages: When the price is above a moving average and EMV is above the zero line, the two indicators provide additional confirmation. A move below the moving average can serve as a potential exit signal.

3) Combine EMV with the Relative Strength Index: RSI can help identify whether the market is overbought or oversold and filter out potential false signals.

3. Advantages and Limitations of Ease of Movement


Advantages:

  • EMV incorporates both price and volume, providing a more comprehensive market view than indicators based solely on price.
  • Positive values generally indicate easier upward price movement, while negative values indicate easier downward price movement.
  • It can help identify potential trend reversals and market turning points.

Limitations:

  • EMV is based on historical price and volume data, so its signals do not predict future price movements.
  • It can generate false signals in range-bound markets or low-volume conditions.
  • It has limited effectiveness when used alone and should be combined with other analytical tools.

4. How to Use Ease of Movement on MEXC


When trading Spot or Futures on MEXC, open the candlestick chart for any trading pair, select Indicators, choose EMV, and click Confirm. You can then adjust the period settings to match your trading style. The commonly used smoothing period is 14.

If you prefer smoother signals, consider using a longer period. Short-term traders can use a shorter period for greater sensitivity. Beginners may want to familiarize themselves with the indicator before using it in live trading and should apply appropriate risk-management measures.


5. Ease of Movement FAQ


5.1 What is Ease of Movement?


Ease of Movement is a volume-based oscillator that compares price changes with trading volume. It measures how easily prices move upward or downward and helps traders assess trend strength.

5.2 How can I use Ease of Movement for trading?


Common methods include checking whether EMV is above or below the zero line to assess market direction, using zero-line crossovers as potential entry signals, identifying divergences between price and the indicator, and confirming trends with moving averages and volume.

5.3 What do Ease of Movement readings mean?


A positive value means the price is rising with relatively little resistance and buyers have the advantage. A negative value means the price is falling with relative ease and sellers are dominant. A value near zero indicates that price movement is difficult and neither side has clear control.

5.4 Is Ease of Movement suitable for intraday trading?


EMV can be used for intraday trading, but shorter timeframes contain more market noise. If you shorten the indicator period, combine EMV with volume, moving averages, or other tools to filter out false signals. Avoid relying on EMV alone during low-volume periods.

5.5 Which indicators can be used with Ease of Movement?


Common combinations include moving averages, the Relative Strength Index, On-Balance Volume (OBV), and volume bars. Signals generally carry more weight when multiple indicators align.

5.6 What is the difference between Ease of Movement and On-Balance Volume?


Both are volume-based indicators. On-Balance Volume uses cumulative volume to gauge buying and selling pressure based on the direction of price changes. The two indicators can complement each other.

5.7 How do I add Ease of Movement on MEXC?


Go to the MEXC website, open Spot or Futures, select Indicators, choose EMV, and click Confirm.


Risk Warning: This content is for educational and informational purposes only and does not constitute financial, investment, or trading advice. Technical indicators are based on historical market data and cannot predict or guarantee future market performance. Digital asset trading involves significant risk and price volatility. Always conduct your own research and assess your risk tolerance before making any trading decisions.

How to Use Ease of Movement (EMV) in Trading: A Complete Beginner's Guide

Key Takeaways

  • Ease of Movement is a volume-based oscillator that measures how easily prices move by combining price and volume data.
  • A positive EMV value indicates that prices are moving upward with relatively little resistance, while a negative value suggests that prices are moving downward with relative ease.
  • Traders can use EMV to assess trends, identify zero-line crossover signals, and analyze divergences.
  • EMV should not be used on its own. Combine it with tools such as moving averages and the Relative Strength Index (RSI) to confirm signals.
  • On MEXC, you can add EMV to the candlestick chart to support your digital asset trading decisions.

1. What Is Ease of Movement?


Ease of Movement (EMV), also known as the Ease of Movement indicator, is a volume-based oscillator developed by technical analysis pioneer Richard W. Arms Jr. EMV fluctuates above and below the zero line. Its primary purpose is to quantify the relationship between price and volume and measure how easily prices move.

When prices rise significantly relative to trading volume, EMV tends to produce a positive value, indicating relatively easy upward price movement. Conversely, when prices fall significantly relative to trading volume, EMV tends to produce a negative value, indicating relatively easy downward price movement. If prices move only slightly despite high volume, price movement is difficult and EMV tends to remain near zero.

2. How to Use Ease of Movement in Trading


2.1 Determine trend direction and strength


When the indicator line is above the zero line, prices are moving upward with relative ease, indicating a bullish trend. The higher the value, the stronger the upward trend.

When the indicator line is below the zero line, prices are moving downward with relative ease, indicating a bearish trend. The lower the value, the stronger the downward trend.

2.2 Use zero-line crossover signals


The zero line is the key dividing line for EMV:

  • Potential buy signal: When EMV crosses above the zero line from negative territory, it may signal the start of an uptrend and a potential long opportunity.
  • Potential sell signal: When EMV crosses below the zero line from positive territory, it may signal the start of a downtrend, suggesting that traders consider reducing exposure or managing risk.

In the charting tools on MEXC, you can clearly track EMV crossovers around the zero line and evaluate them alongside price action.


2.3 Identify divergence signals


Divergence can help traders identify potential reversals:

  • Bullish divergence: The price makes a lower low while EMV forms a higher low. This suggests that selling pressure is weakening a potential bullish reversal may take shape.
  • Bearish divergence: The price makes a higher high while EMV forms a lower high. This suggests that upward momentum is weakening and a potential bearish reversal may take shape.

2.4 Use EMV with other indicators for confirmation


EMV is not a standalone trading system. It is most effective when used to confirm other signals:

1) Combine EMV with volume: A crossover above the zero line accompanied by rising volume can make a breakout signal more reliable. Treat EMV signals during low-volume periods with caution.

2) Combine EMV with moving averages: When the price is above a moving average and EMV is above the zero line, the two indicators provide additional confirmation. A move below the moving average can serve as a potential exit signal.

3) Combine EMV with the Relative Strength Index: RSI can help identify whether the market is overbought or oversold and filter out potential false signals.

3. Advantages and Limitations of Ease of Movement


Advantages:

  • EMV incorporates both price and volume, providing a more comprehensive market view than indicators based solely on price.
  • Positive values generally indicate easier upward price movement, while negative values indicate easier downward price movement.
  • It can help identify potential trend reversals and market turning points.

Limitations:

  • EMV is based on historical price and volume data, so its signals do not predict future price movements.
  • It can generate false signals in range-bound markets or low-volume conditions.
  • It has limited effectiveness when used alone and should be combined with other analytical tools.

4. How to Use Ease of Movement on MEXC


When trading Spot or Futures on MEXC, open the candlestick chart for any trading pair, select Indicators, choose EMV, and click Confirm. You can then adjust the period settings to match your trading style. The commonly used smoothing period is 14.

If you prefer smoother signals, consider using a longer period. Short-term traders can use a shorter period for greater sensitivity. Beginners may want to familiarize themselves with the indicator before using it in live trading and should apply appropriate risk-management measures.


5. Ease of Movement FAQ


5.1 What is Ease of Movement?


Ease of Movement is a volume-based oscillator that compares price changes with trading volume. It measures how easily prices move upward or downward and helps traders assess trend strength.

5.2 How can I use Ease of Movement for trading?


Common methods include checking whether EMV is above or below the zero line to assess market direction, using zero-line crossovers as potential entry signals, identifying divergences between price and the indicator, and confirming trends with moving averages and volume.

5.3 What do Ease of Movement readings mean?


A positive value means the price is rising with relatively little resistance and buyers have the advantage. A negative value means the price is falling with relative ease and sellers are dominant. A value near zero indicates that price movement is difficult and neither side has clear control.

5.4 Is Ease of Movement suitable for intraday trading?


EMV can be used for intraday trading, but shorter timeframes contain more market noise. If you shorten the indicator period, combine EMV with volume, moving averages, or other tools to filter out false signals. Avoid relying on EMV alone during low-volume periods.

5.5 Which indicators can be used with Ease of Movement?


Common combinations include moving averages, the Relative Strength Index, On-Balance Volume (OBV), and volume bars. Signals generally carry more weight when multiple indicators align.

5.6 What is the difference between Ease of Movement and On-Balance Volume?


Both are volume-based indicators. On-Balance Volume uses cumulative volume to gauge buying and selling pressure based on the direction of price changes. The two indicators can complement each other.

5.7 How do I add Ease of Movement on MEXC?


Go to the MEXC website, open Spot or Futures, select Indicators, choose EMV, and click Confirm.


Risk Warning: This content is for educational and informational purposes only and does not constitute financial, investment, or trading advice. Technical indicators are based on historical market data and cannot predict or guarantee future market performance. Digital asset trading involves significant risk and price volatility. Always conduct your own research and assess your risk tolerance before making any trading decisions.