क्रिप्टो खरीदें
मार्केट
स्पॉट
फ़्यूचर्सBTC
कमाएँ
इवेंट सेंटर
रिवॉर्ड हब
अधिक
How to Use Fibonacci Retracement in Trading: A Complete Beginner's GuideHow to Use Fibonacci Retracement in Trading: A Complete Beginner's Guide
कैटेगरी की लिस्ट
कैंसिल करें

How to Use Fibonacci Retracement in Trading: A Complete Beginner's Guide

Key Takeaways

  • Fibonacci retracement is a technical analysis tool based on mathematical ratios that helps identify potential support and resistance levels.
  • The main retracement levels are 23.6%, 38.2%, 50%, 61.8%, and 78.6%. The 61.8% level is known as the golden ratio.
  • The tool can be used in both uptrends and downtrends to help traders assess entry points, stop-loss levels, and profit targets.
  • Combining it with candlestick patterns, volume, moving averages, or other indicators may improve signal reliability.
  • Fibonacci retracement is available in MEXC charting tools for analyzing crypto assets, Futures, and other markets.

1. What Is Fibonacci Retracement?


Fibonacci retracement is based on the Fibonacci sequence, which was introduced to Western mathematics by Italian mathematician Leonardo Fibonacci: 0, 1, 1, 2, 3, 5, 8, 13, 21, 34, 55, 89, and so on. Each number is the sum of the two preceding numbers. As the sequence continues, the ratio of each number to the following number approaches 0.618, which is known as the golden ratio.

Applying these ratios to price charts produces the key retracement levels used in trading: 23.6%, 38.2%, 50%, 61.8%, and 78.6%. Although 50% is not strictly a Fibonacci ratio, it is widely used because it represents the psychological threshold at which price has retraced half of its previous move.

After a clear upward or downward move, price often retraces instead of continuing in one direction without interruption. The Fibonacci retracement tool can help traders identify price areas where a pullback may pause, providing potential opportunities to trade in the direction of the prevailing trend.

2. What Fibonacci Retracement Levels Mean


Fibonacci retracement levels are commonly interpreted as follows:

23.6% level: This usually represents a shallow pullback and is often seen in very strong trends. If price retraces only to this level before resuming its move, it may indicate strong buying or selling momentum.

38.2% level: This is a commonly watched area during a moderate pullback and an area where many short-term traders look for potential entries.

50% level: Although this is not technically a Fibonacci ratio, its strong psychological significance makes it one of the most closely watched retracement areas.

61.8% level: This is the golden ratio and is generally considered the most important retracement level. A rebound from this level may suggest that the original trend could continue, while a break below it may indicate a possible trend reversal.

78.6% level: This represents a deep pullback that is close to a full retracement and may help traders assess whether the original trend remains intact.

3. Fibonacci Retracement Trading Strategies


3.1 Confirm signals with candlestick patterns


Using Fibonacci retracement alone can produce misleading signals. A more cautious approach is to wait for price to reach a key retracement level and then check for bullish or bearish candlestick patterns, such as a hammer, engulfing pattern, or doji.

3.2 Combine with support and resistance levels


When a Fibonacci retracement level aligns with a historical support or resistance level, the confluence may strengthen the significance of that price area. Many professional traders look for this type of confirmation.

3.3 Combine with moving averages


Add the 50-day or 200-day moving average to the chart. If a moving average is close to a Fibonacci level, that area may provide stronger support or resistance.

3.4 Use Fibonacci retracement for day trading


Day traders can apply Fibonacci retracement to 5-minute or 15-minute charts and use significant highs and lows from the current or previous day as reference points. Because shorter timeframes contain more market noise, consider using volume indicators for additional confirmation.

3.5 Use Fibonacci retracement for swing trading


Swing traders may find daily or 4-hour charts more suitable. Use a significant market move from the past several weeks or months as the basis for the retracement, and pay particular attention to deeper pullbacks around the 50% and 61.8% levels, which may offer more favorable risk-reward setups.

4. How to Draw Fibonacci Retracement Levels in an Uptrend


Follow these steps to use the tool in an uptrend:

1) Identify a clear trend swing. Find a clear upward move on the chart and identify its starting point, or swing low, and ending point, or swing high.

2) Select the Fibonacci tool. Select the Fibonacci retracement tool from the chart toolbar on MEXC.

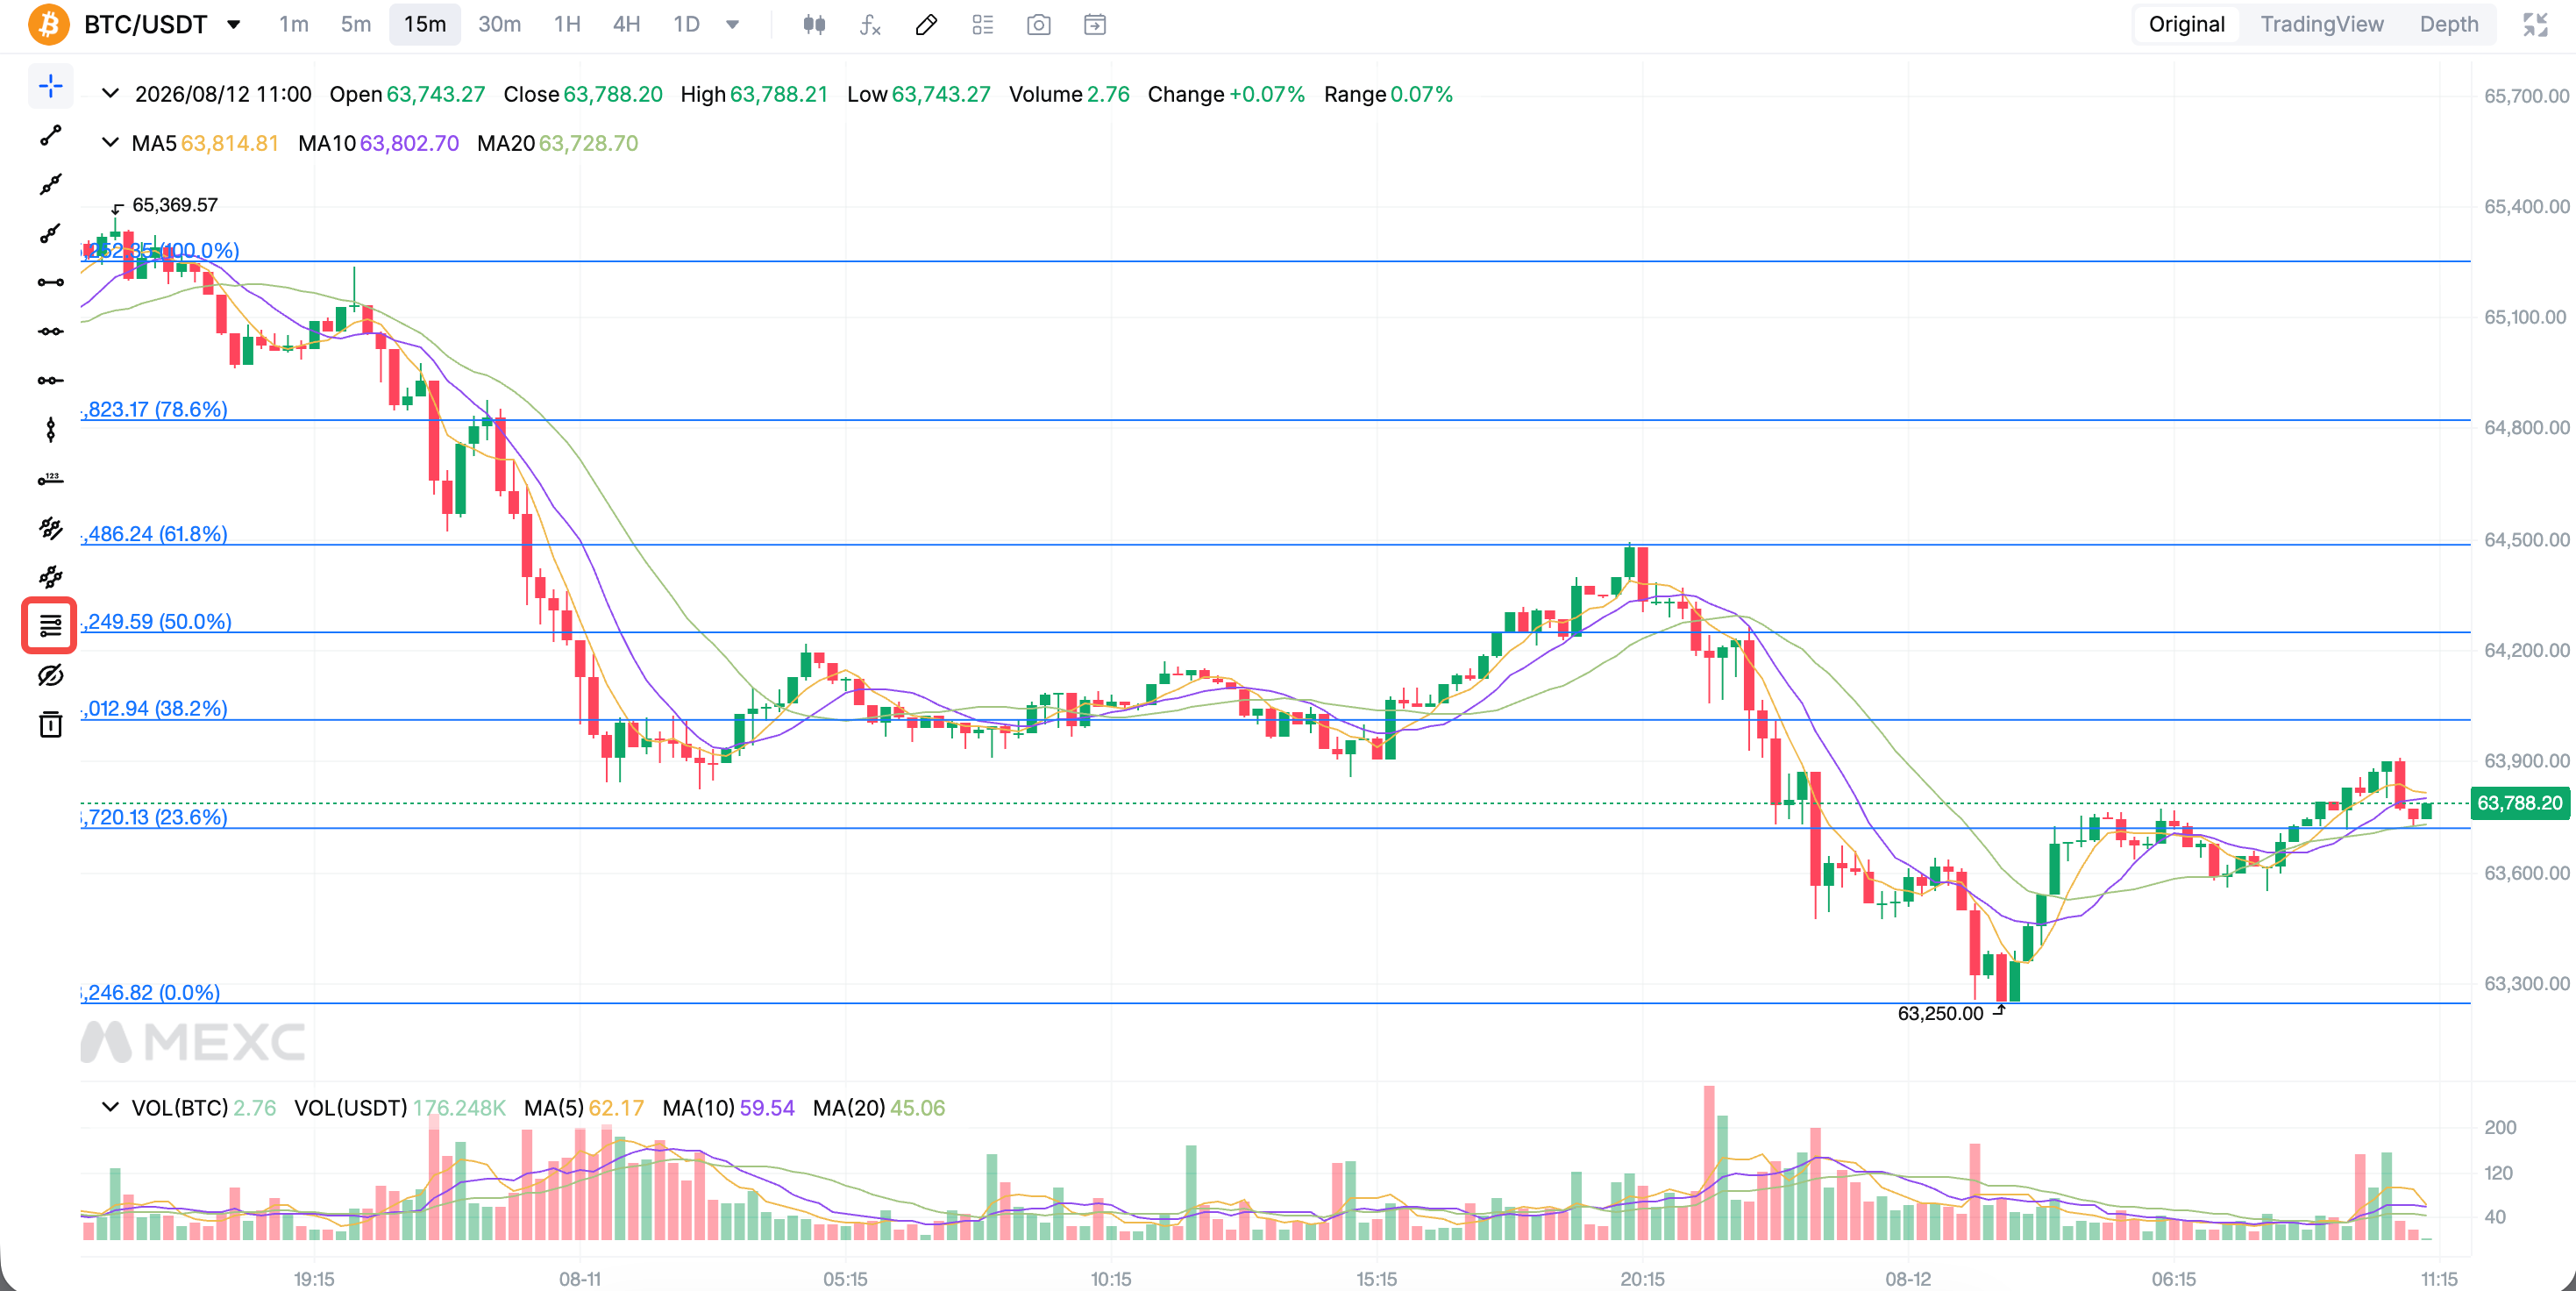
3) Drag from the low to the high. Anchor the starting point at the most recent swing low, then drag the tool to the swing high. It will automatically draw the 23.6%, 38.2%, 50%, 61.8%, and 78.6% levels on the chart.

4) Observe the price reaction. As price pulls back from the high, watch for signs of stabilization near these levels.

In a downtrend, reverse the direction and drag from the swing high to the swing low to identify potential resistance during a rebound.

5. How to Use Fibonacci Retracement on MEXC


MEXC provides charting tools that allow users to apply Fibonacci retracement when conducting technical analysis:

1) Log in to your MEXC account. Go to the Spot or Futures trading page, then open the candlestick chart for the relevant trading pair.

2) Find the drawing tools on the left side of the chart and select the Fibonacci retracement tool.

3) Identify a significant price move on the chart and drag from its starting point to its ending point. The system will automatically generate the retracement levels.

4) Depending on your trading needs, customize the displayed retracement levels and line styles in the settings.

5) Use other indicators available on MEXC, such as the Relative Strength Index, moving averages, and volume, for additional confirmation before placing an order.


6. Common Mistakes When Using Fibonacci Retracement


Mistake 1: Using it in a range-bound market with no clear trend. The tool is more useful when a clear trend is present. In a sideways market, it may generate many unreliable signals.

Mistake 2: Relying on a single indicator. Fibonacci retracement should be used together with other technical tools.

Mistake 3: Selecting the wrong swing high and low. Use the most recent and significant swing points. Otherwise, the retracement framework may become less meaningful.

Mistake 4: Ignoring stop-loss placement. A stop-loss may be placed below the next Fibonacci level. If price breaks through that level, the original setup may no longer be valid.

7. Advantages and Limitations of Fibonacci Retracement


Advantages: It provides clear price reference levels, can be used across different timeframes and markets, may produce more reliable signals when combined with other tools, and helps traders develop systematic entry and exit rules.

Limitations: Selecting swing highs and lows is subjective; the tool may be less reliable in highly volatile markets; it cannot guarantee that price will reverse at a specific level; and using it effectively requires practical experience.

8. Fibonacci Retracement FAQ


8.1 How do I use Fibonacci retracement correctly?


The key is to select significant swing highs and lows. In an uptrend, drag from the swing low to the swing high. In a downtrend, reverse the direction. Then observe how price reacts near the key levels of 38.2%, 50%, and 61.8%, and use other indicators for confirmation before entering a position.

8.2 What is the golden rule of Fibonacci retracement?


The golden rule is to pay close attention to the 61.8% golden ratio level. Historical price behavior suggests that reversals may occur more frequently around this level. If price breaks below 61.8%, the likelihood that the original trend has ended may increase.

8.3 What does the 50% retracement rule mean?


The 50% retracement rule refers to the tendency for price to retrace half of a previous move before continuing in the original direction. Although 50% is not strictly a Fibonacci ratio, its psychological significance makes it an important reference for assessing the strength of a trend.

8.4 Is Fibonacci retracement suitable for day trading?


Yes. Day traders can use the tool on 5-minute or 15-minute charts and select highs and lows from the current or previous day. Consider using volume and short-period moving averages to filter out false signals caused by short-term market noise.

8.5 How do you use Fibonacci retracement for swing trading?


For swing trading, consider using daily or 4-hour charts and selecting a significant market move from the past several weeks or months. Focus on pullbacks around the 38.2%, 50%, and 61.8% levels. A stop-loss may be placed near the 78.6% level or the starting point of the swing.

8.6 Which indicators work well with Fibonacci retracement?


Common choices include moving averages, the Relative Strength Index, volume, and support and resistance levels. When multiple signals align in the same price area, they may provide stronger confirmation for a trading setup.

8.7 Can Fibonacci retracement be used for crypto trading?


Yes. Fibonacci retracement is based on mathematical ratios rather than a specific asset, so it can be applied to crypto, forex, stocks, commodities, and other markets. On MEXC, users can apply the tool directly when analyzing different digital assets.


Risk Warning: This content is for educational and informational purposes only and does not constitute financial, investment, or trading advice. Technical indicators are based on historical market data and cannot predict or guarantee future market performance. Digital asset trading involves significant risk and price volatility. Always conduct your own research and assess your risk tolerance before making any trading decisions.

How to Use Fibonacci Retracement in Trading: A Complete Beginner's Guide

Key Takeaways

  • Fibonacci retracement is a technical analysis tool based on mathematical ratios that helps identify potential support and resistance levels.
  • The main retracement levels are 23.6%, 38.2%, 50%, 61.8%, and 78.6%. The 61.8% level is known as the golden ratio.
  • The tool can be used in both uptrends and downtrends to help traders assess entry points, stop-loss levels, and profit targets.
  • Combining it with candlestick patterns, volume, moving averages, or other indicators may improve signal reliability.
  • Fibonacci retracement is available in MEXC charting tools for analyzing crypto assets, Futures, and other markets.

1. What Is Fibonacci Retracement?


Fibonacci retracement is based on the Fibonacci sequence, which was introduced to Western mathematics by Italian mathematician Leonardo Fibonacci: 0, 1, 1, 2, 3, 5, 8, 13, 21, 34, 55, 89, and so on. Each number is the sum of the two preceding numbers. As the sequence continues, the ratio of each number to the following number approaches 0.618, which is known as the golden ratio.

Applying these ratios to price charts produces the key retracement levels used in trading: 23.6%, 38.2%, 50%, 61.8%, and 78.6%. Although 50% is not strictly a Fibonacci ratio, it is widely used because it represents the psychological threshold at which price has retraced half of its previous move.

After a clear upward or downward move, price often retraces instead of continuing in one direction without interruption. The Fibonacci retracement tool can help traders identify price areas where a pullback may pause, providing potential opportunities to trade in the direction of the prevailing trend.

2. What Fibonacci Retracement Levels Mean


Fibonacci retracement levels are commonly interpreted as follows:

23.6% level: This usually represents a shallow pullback and is often seen in very strong trends. If price retraces only to this level before resuming its move, it may indicate strong buying or selling momentum.

38.2% level: This is a commonly watched area during a moderate pullback and an area where many short-term traders look for potential entries.

50% level: Although this is not technically a Fibonacci ratio, its strong psychological significance makes it one of the most closely watched retracement areas.

61.8% level: This is the golden ratio and is generally considered the most important retracement level. A rebound from this level may suggest that the original trend could continue, while a break below it may indicate a possible trend reversal.

78.6% level: This represents a deep pullback that is close to a full retracement and may help traders assess whether the original trend remains intact.

3. Fibonacci Retracement Trading Strategies


3.1 Confirm signals with candlestick patterns


Using Fibonacci retracement alone can produce misleading signals. A more cautious approach is to wait for price to reach a key retracement level and then check for bullish or bearish candlestick patterns, such as a hammer, engulfing pattern, or doji.

3.2 Combine with support and resistance levels


When a Fibonacci retracement level aligns with a historical support or resistance level, the confluence may strengthen the significance of that price area. Many professional traders look for this type of confirmation.

3.3 Combine with moving averages


Add the 50-day or 200-day moving average to the chart. If a moving average is close to a Fibonacci level, that area may provide stronger support or resistance.

3.4 Use Fibonacci retracement for day trading


Day traders can apply Fibonacci retracement to 5-minute or 15-minute charts and use significant highs and lows from the current or previous day as reference points. Because shorter timeframes contain more market noise, consider using volume indicators for additional confirmation.

3.5 Use Fibonacci retracement for swing trading


Swing traders may find daily or 4-hour charts more suitable. Use a significant market move from the past several weeks or months as the basis for the retracement, and pay particular attention to deeper pullbacks around the 50% and 61.8% levels, which may offer more favorable risk-reward setups.

4. How to Draw Fibonacci Retracement Levels in an Uptrend


Follow these steps to use the tool in an uptrend:

1) Identify a clear trend swing. Find a clear upward move on the chart and identify its starting point, or swing low, and ending point, or swing high.

2) Select the Fibonacci tool. Select the Fibonacci retracement tool from the chart toolbar on MEXC.

3) Drag from the low to the high. Anchor the starting point at the most recent swing low, then drag the tool to the swing high. It will automatically draw the 23.6%, 38.2%, 50%, 61.8%, and 78.6% levels on the chart.

4) Observe the price reaction. As price pulls back from the high, watch for signs of stabilization near these levels.

In a downtrend, reverse the direction and drag from the swing high to the swing low to identify potential resistance during a rebound.

5. How to Use Fibonacci Retracement on MEXC


MEXC provides charting tools that allow users to apply Fibonacci retracement when conducting technical analysis:

1) Log in to your MEXC account. Go to the Spot or Futures trading page, then open the candlestick chart for the relevant trading pair.

2) Find the drawing tools on the left side of the chart and select the Fibonacci retracement tool.

3) Identify a significant price move on the chart and drag from its starting point to its ending point. The system will automatically generate the retracement levels.

4) Depending on your trading needs, customize the displayed retracement levels and line styles in the settings.

5) Use other indicators available on MEXC, such as the Relative Strength Index, moving averages, and volume, for additional confirmation before placing an order.


6. Common Mistakes When Using Fibonacci Retracement


Mistake 1: Using it in a range-bound market with no clear trend. The tool is more useful when a clear trend is present. In a sideways market, it may generate many unreliable signals.

Mistake 2: Relying on a single indicator. Fibonacci retracement should be used together with other technical tools.

Mistake 3: Selecting the wrong swing high and low. Use the most recent and significant swing points. Otherwise, the retracement framework may become less meaningful.

Mistake 4: Ignoring stop-loss placement. A stop-loss may be placed below the next Fibonacci level. If price breaks through that level, the original setup may no longer be valid.

7. Advantages and Limitations of Fibonacci Retracement


Advantages: It provides clear price reference levels, can be used across different timeframes and markets, may produce more reliable signals when combined with other tools, and helps traders develop systematic entry and exit rules.

Limitations: Selecting swing highs and lows is subjective; the tool may be less reliable in highly volatile markets; it cannot guarantee that price will reverse at a specific level; and using it effectively requires practical experience.

8. Fibonacci Retracement FAQ


8.1 How do I use Fibonacci retracement correctly?


The key is to select significant swing highs and lows. In an uptrend, drag from the swing low to the swing high. In a downtrend, reverse the direction. Then observe how price reacts near the key levels of 38.2%, 50%, and 61.8%, and use other indicators for confirmation before entering a position.

8.2 What is the golden rule of Fibonacci retracement?


The golden rule is to pay close attention to the 61.8% golden ratio level. Historical price behavior suggests that reversals may occur more frequently around this level. If price breaks below 61.8%, the likelihood that the original trend has ended may increase.

8.3 What does the 50% retracement rule mean?


The 50% retracement rule refers to the tendency for price to retrace half of a previous move before continuing in the original direction. Although 50% is not strictly a Fibonacci ratio, its psychological significance makes it an important reference for assessing the strength of a trend.

8.4 Is Fibonacci retracement suitable for day trading?


Yes. Day traders can use the tool on 5-minute or 15-minute charts and select highs and lows from the current or previous day. Consider using volume and short-period moving averages to filter out false signals caused by short-term market noise.

8.5 How do you use Fibonacci retracement for swing trading?


For swing trading, consider using daily or 4-hour charts and selecting a significant market move from the past several weeks or months. Focus on pullbacks around the 38.2%, 50%, and 61.8% levels. A stop-loss may be placed near the 78.6% level or the starting point of the swing.

8.6 Which indicators work well with Fibonacci retracement?


Common choices include moving averages, the Relative Strength Index, volume, and support and resistance levels. When multiple signals align in the same price area, they may provide stronger confirmation for a trading setup.

8.7 Can Fibonacci retracement be used for crypto trading?


Yes. Fibonacci retracement is based on mathematical ratios rather than a specific asset, so it can be applied to crypto, forex, stocks, commodities, and other markets. On MEXC, users can apply the tool directly when analyzing different digital assets.


Risk Warning: This content is for educational and informational purposes only and does not constitute financial, investment, or trading advice. Technical indicators are based on historical market data and cannot predict or guarantee future market performance. Digital asset trading involves significant risk and price volatility. Always conduct your own research and assess your risk tolerance before making any trading decisions.