क्रिप्टो खरीदें
मार्केट
स्पॉट
फ़्यूचर्सBTC
कमाएँ
इवेंट सेंटर
रिवॉर्ड हब
अधिक
How to Use Moving Average Indicators in Trading: A Complete Beginner's GuideHow to Use Moving Average Indicators in Trading: A Complete Beginner's Guide
कैटेगरी की लिस्ट
कैंसिल करें

How to Use Moving Average Indicators in Trading: A Complete Beginner's Guide

Key Takeaways

  • A moving average is a core technical indicator that smooths price fluctuations by averaging historical price data, helping traders identify market trends.
  • Common types include the simple moving average, exponential moving average, and weighted moving average, each offering different levels of sensitivity and suitable use cases.
  • The four main practical uses of moving averages are identifying trend direction, finding dynamic support and resistance, capturing moving average crossover signals, and setting trailing stops.
  • Different trading styles call for different moving average settings. Longer periods provide more stable signals, while shorter periods respond more quickly to price changes.
  • MEXC provides built-in moving average tools with customizable settings that can be used to develop Spot and Futures trading strategies.

1. What Is a Moving Average?


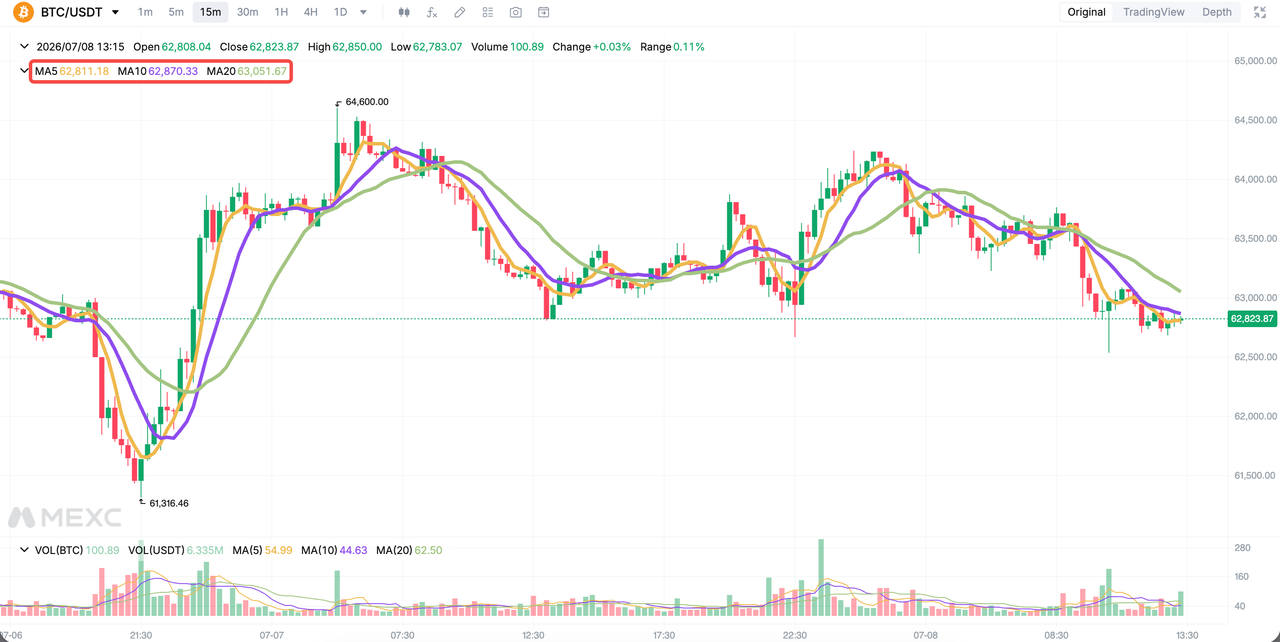
A moving average (MA) is a technical indicator that calculates the average price over a specified period and plots the result as a smooth line. Its primary purpose is to filter out the noise created by short-term market fluctuations, allowing traders to see the overall direction of price movements more clearly.

For example, suppose the closing prices of an asset over the past five trading days were 1 USDT, 2 USDT, 3 USDT, 4 USDT, and 5 USDT. The five-day moving average would be:
(1 + 2 + 3 + 4 + 5) / 5 = 3 USDT

When new price data becomes available, the indicator removes the oldest data point and includes the latest one. As a result, the average continuously moves over time, which is where the indicator gets its name.

2. Main Types of Moving Averages


2.1 Simple Moving Average (SMA)


A simple moving average calculates the average of all closing prices within a specified period, giving each data point equal weight. Its main advantage is that it is smooth and less affected by short-term fluctuations, making it suitable for identifying medium- to long-term trends. However, it reacts more slowly to recent price changes.

2.2 Exponential Moving Average (EMA)


An exponential moving average assigns greater weight to more recent prices, while older data has less influence on the calculation. As a result, it responds more quickly to current market prices and can help traders identify trend changes sooner. It is commonly used by day traders and swing traders.

2.3 Weighted Moving Average (WMA)


A weighted moving average combines characteristics of both SMA and EMA. It assigns weight to price data on a linear basis, maintaining a degree of stability while tracking recent price movements more closely than a simple moving average.


3. Practical Uses of Moving Averages in Trading


3.1 Identify the trend direction


This is the most basic use of a moving average. When the price is above the moving average and the moving average is sloping upward, the market is generally considered to be in an uptrend, and traders may look for long opportunities.

When the price is below the moving average and the moving average is sloping downward, the market is generally considered to be in a downtrend, and traders may choose to stay on the sidelines or look for short opportunities.

Many traders use the 200-period moving average as a key reference for identifying the prevailing trend on their chosen timeframe.

3.2 Find dynamic support and resistance


In trending markets, moving averages often act as dynamic support or resistance levels.

During an uptrend, a price pullback toward the moving average followed by a rebound may provide a potential entry opportunity. During a downtrend, a price rally toward the moving average followed by rejection may present an opportunity to exit long positions or open short positions.

Compared with entering after a sharp price increase, waiting for the price to return closer to the moving average may provide a smaller stop-loss range and a more favorable risk-reward ratio.

3.3 Use moving average crossover signals


Moving average crossovers are a classic buy and sell signal:
  • Golden cross: A short-term moving average, such as the 50-period MA, crosses above a long-term moving average, such as the 200-period MA. This is generally regarded as a bullish signal and may indicate the beginning of a longer-term uptrend.
  • Death cross: A short-term moving average crosses below a long-term moving average. This is generally regarded as a bearish signal.

Moving average crossover strategies tend to work better in markets with clear trends. In sideways markets, however, frequent false signals may occur and lead to repeated small losses. It is therefore recommended to combine moving averages with other technical indicators, such as trading volume and support and resistance levels.

3.4 Use moving averages as trailing stops


Traders can also use moving averages to manage trailing stops while holding a position.
For example, when holding a long position, a trader may continue holding as long as the price does not close decisively below the 50-period moving average. Once the closing price falls below the moving average, the trader may close the position.

Longer-period moving averages can help traders stay in larger trends, while shorter-period moving averages may help lock in profits earlier and reduce drawdowns.

4. How to Use Moving Averages on MEXC


Navigation: MEXC official website → Spot/Futures → Indicators → MA

MEXC allows users to customize the moving average period, type, and color. Multiple moving averages can also be displayed at the same time to create a moving average crossover strategy.

Whether trading Spot or Futures, users can incorporate moving averages into their entry, exit, and stop-loss plans to make their trading decisions more disciplined and systematic.


5. Moving Average FAQ


5.1 How do traders use moving averages?


Moving averages are mainly used in four ways: identifying trend direction, finding dynamic support and resistance, generating buy and sell signals through moving average crossovers, and serving as trailing stop tools to lock in profits.

5.2 How do I use the 50-period and 200-period moving averages?


The combination of the 50-period and 200-period moving averages is a widely used approach to identifying long-term trends.

When the 50-period moving average crosses above the 200-period moving average, it forms a golden cross and is generally considered bullish. When it crosses below the 200-period moving average, it forms a death cross and is generally considered bearish.

The position of the price relative to the 200-period moving average is also an important reference for identifying bullish and bearish market conditions.

5.3 Should I use a 200-period EMA or SMA?


For identifying long-term market trends, the simple moving average is generally smoother and may provide a more stable reference.

Traders who want the indicator to respond more quickly to price changes may prefer the exponential moving average. Neither is universally better, and the choice depends on the trader's trading style.

5.4 Is the 20-period or 50-period moving average better?


The 20-period moving average is more suitable for capturing short-term momentum. It responds quickly but may produce more market noise.

The 50-period moving average is more suitable for identifying medium-term trends and generally provides more stable signals. Short-term traders may focus more on the 20-period moving average, while swing traders may prefer the 50-period moving average.

5.5 What is the best moving average setup for day trading?


A common approach is to use a combination of the 9-period and 21-period exponential moving averages on shorter-term charts.

Using a 10-minute or 15-minute chart may help reduce the false signals that occur on extremely short timeframes.

5.6 What is the moving average formula?


A simple moving average is calculated by adding the closing prices over a specified period and dividing the total by the number of periods.

For example, a 10-day moving average equals the sum of the closing prices from the most recent 10 trading days divided by 10. An exponential moving average uses a similar calculation but assigns greater weight to more recent data.

Moving averages are an essential technical analysis tool because they are simple, intuitive, and practical. By mastering their four main uses—trend identification, dynamic support and resistance, crossover signals, and trailing stops—and selecting suitable parameters based on their trading timeframe, traders can improve the quality of their trading decisions.


Risk Warning: Technical indicators are based on historical data and do not guarantee future performance. Digital assets are highly volatile. Trade cautiously based on your risk tolerance and avoid blindly following market trends.

How to Use Moving Average Indicators in Trading: A Complete Beginner's Guide

Key Takeaways

  • A moving average is a core technical indicator that smooths price fluctuations by averaging historical price data, helping traders identify market trends.
  • Common types include the simple moving average, exponential moving average, and weighted moving average, each offering different levels of sensitivity and suitable use cases.
  • The four main practical uses of moving averages are identifying trend direction, finding dynamic support and resistance, capturing moving average crossover signals, and setting trailing stops.
  • Different trading styles call for different moving average settings. Longer periods provide more stable signals, while shorter periods respond more quickly to price changes.
  • MEXC provides built-in moving average tools with customizable settings that can be used to develop Spot and Futures trading strategies.

1. What Is a Moving Average?


A moving average (MA) is a technical indicator that calculates the average price over a specified period and plots the result as a smooth line. Its primary purpose is to filter out the noise created by short-term market fluctuations, allowing traders to see the overall direction of price movements more clearly.

For example, suppose the closing prices of an asset over the past five trading days were 1 USDT, 2 USDT, 3 USDT, 4 USDT, and 5 USDT. The five-day moving average would be:
(1 + 2 + 3 + 4 + 5) / 5 = 3 USDT

When new price data becomes available, the indicator removes the oldest data point and includes the latest one. As a result, the average continuously moves over time, which is where the indicator gets its name.


2. Main Types of Moving Averages


2.1 Simple Moving Average (SMA)


A simple moving average calculates the average of all closing prices within a specified period, giving each data point equal weight. Its main advantage is that it is smooth and less affected by short-term fluctuations, making it suitable for identifying medium- to long-term trends. However, it reacts more slowly to recent price changes.

2.2 Exponential Moving Average (EMA)


An exponential moving average assigns greater weight to more recent prices, while older data has less influence on the calculation. As a result, it responds more quickly to current market prices and can help traders identify trend changes sooner. It is commonly used by day traders and swing traders.

2.3 Weighted Moving Average (WMA)


A weighted moving average combines characteristics of both SMA and EMA. It assigns weight to price data on a linear basis, maintaining a degree of stability while tracking recent price movements more closely than a simple moving average.


3. Practical Uses of Moving Averages in Trading


3.1 Identify the trend direction


This is the most basic use of a moving average. When the price is above the moving average and the moving average is sloping upward, the market is generally considered to be in an uptrend, and traders may look for long opportunities.

When the price is below the moving average and the moving average is sloping downward, the market is generally considered to be in a downtrend, and traders may choose to stay on the sidelines or look for short opportunities.

Many traders use the 200-period moving average as a key reference for identifying the prevailing trend on their chosen timeframe.

3.2 Find dynamic support and resistance


In trending markets, moving averages often act as dynamic support or resistance levels.

During an uptrend, a price pullback toward the moving average followed by a rebound may provide a potential entry opportunity. During a downtrend, a price rally toward the moving average followed by rejection may present an opportunity to exit long positions or open short positions.

Compared with entering after a sharp price increase, waiting for the price to return closer to the moving average may provide a smaller stop-loss range and a more favorable risk-reward ratio.

3.3 Use moving average crossover signals


Moving average crossovers are a classic buy and sell signal:
  • Golden cross: A short-term moving average, such as the 50-period MA, crosses above a long-term moving average, such as the 200-period MA. This is generally regarded as a bullish signal and may indicate the beginning of a longer-term uptrend.
  • Death cross: A short-term moving average crosses below a long-term moving average. This is generally regarded as a bearish signal.

Moving average crossover strategies tend to work better in markets with clear trends. In sideways markets, however, frequent false signals may occur and lead to repeated small losses. It is therefore recommended to combine moving averages with other technical indicators, such as trading volume and support and resistance levels.

3.4 Use moving averages as trailing stops


Traders can also use moving averages to manage trailing stops while holding a position.
For example, when holding a long position, a trader may continue holding as long as the price does not close decisively below the 50-period moving average. Once the closing price falls below the moving average, the trader may close the position.

Longer-period moving averages can help traders stay in larger trends, while shorter-period moving averages may help lock in profits earlier and reduce drawdowns.

4. How to Use Moving Averages on MEXC


Navigation: MEXC official website → Spot/Futures → Indicators → MA

MEXC allows users to customize the moving average period, type, and color. Multiple moving averages can also be displayed at the same time to create a moving average crossover strategy.

Whether trading Spot or Futures, users can incorporate moving averages into their entry, exit, and stop-loss plans to make their trading decisions more disciplined and systematic.


5. Moving Average FAQ


5.1 How do traders use moving averages?


Moving averages are mainly used in four ways: identifying trend direction, finding dynamic support and resistance, generating buy and sell signals through moving average crossovers, and serving as trailing stop tools to lock in profits.

5.2 How do I use the 50-period and 200-period moving averages?


The combination of the 50-period and 200-period moving averages is a widely used approach to identifying long-term trends.

When the 50-period moving average crosses above the 200-period moving average, it forms a golden cross and is generally considered bullish. When it crosses below the 200-period moving average, it forms a death cross and is generally considered bearish.

The position of the price relative to the 200-period moving average is also an important reference for identifying bullish and bearish market conditions.

5.3 Should I use a 200-period EMA or SMA?


For identifying long-term market trends, the simple moving average is generally smoother and may provide a more stable reference.

Traders who want the indicator to respond more quickly to price changes may prefer the exponential moving average. Neither is universally better, and the choice depends on the trader's trading style.

5.4 Is the 20-period or 50-period moving average better?


The 20-period moving average is more suitable for capturing short-term momentum. It responds quickly but may produce more market noise.

The 50-period moving average is more suitable for identifying medium-term trends and generally provides more stable signals. Short-term traders may focus more on the 20-period moving average, while swing traders may prefer the 50-period moving average.

5.5 What is the best moving average setup for day trading?


A common approach is to use a combination of the 9-period and 21-period exponential moving averages on shorter-term charts.

Using a 10-minute or 15-minute chart may help reduce the false signals that occur on extremely short timeframes.

5.6 What is the moving average formula?


A simple moving average is calculated by adding the closing prices over a specified period and dividing the total by the number of periods.

For example, a 10-day moving average equals the sum of the closing prices from the most recent 10 trading days divided by 10. An exponential moving average uses a similar calculation but assigns greater weight to more recent data.

Moving averages are an essential technical analysis tool because they are simple, intuitive, and practical. By mastering their four main uses—trend identification, dynamic support and resistance, crossover signals, and trailing stops—and selecting suitable parameters based on their trading timeframe, traders can improve the quality of their trading decisions.


Risk Warning: Technical indicators are based on historical data and do not guarantee future performance. Digital assets are highly volatile. Trade cautiously based on your risk tolerance and avoid blindly following market trends.