क्रिप्टो खरीदें
मार्केट
स्पॉट
फ़्यूचर्सBTC
कमाएँ
इवेंट सेंटर
रिवॉर्ड हब
अधिक
How to Use Support and Resistance Levels in Trading: A Complete Beginner's GuideHow to Use Support and Resistance Levels in Trading: A Complete Beginner's Guide
कैटेगरी की लिस्ट
कैंसिल करें

How to Use Support and Resistance Levels in Trading: A Complete Beginner's Guide

Key Takeaways:

  • Support is an area where a falling price may stabilize or rebound, while resistance is an area where a rising price may stall or reverse.
  • Common ways to identify support and resistance include reviewing historical highs and lows, identifying price consolidation zones, and analyzing trading volume.
  • Support and resistance can switch roles. After a breakout, former resistance may become support.
  • Common strategies include trading bounces, trading breakouts, and placing stop-loss orders around support and resistance.
  • Support and resistance should be treated as price zones rather than exact levels and used alongside other technical tools.

1. What Are Support and Resistance?


Support is a price level where a falling market may stabilize and rebound. At this level, buying interest may begin to outweigh selling pressure, potentially slowing or reversing the decline. Support can be compared to a floor where the price may bounce off after reaching it.

Resistance is a price level where a rising market may stall or pull back. At this level, selling pressure may begin to outweigh buying interest as traders take profits or reduce their positions. Resistance can be compared to a ceiling that the price may struggle to break through.

For example, suppose a crypto asset has fallen to around $10,000 three times over the past six months and rebounded quickly each time. The $10,000 level could be considered strong support. If the asset has repeatedly approached $12,000 but failed to break above it, $12,000 could be considered a clear resistance level.

2. How to Identify Support and Resistance


You can use the candlestick charting tools on MEXC to draw and identify support and resistance levels using the following methods.

2.1 Review Historical Highs and Lows


Look for previous peaks and troughs where the price has reversed several times. The more often the price tests and reacts around the same level, the more reliable that level may be. As a general guideline, multiple reversal points around a similar price level, with some time between each test, can make the level more significant.

2.2 Identify Price Consolidation Zones


When the price trades within a narrow range for an extended period, that consolidation zone may later act as support or resistance. Many traders may have opened positions within the zone and could react similarly when the price returns to it.

2.3 Analyze Trading Volume


Trading volume can help traders assess the strength of support and resistance. A high-volume rebound near support or reversal near resistance may indicate stronger market participation and make the level more significant.

2.4 Use Technical Indicators


In addition to drawing horizontal lines manually, traders can use technical indicators to identify dynamic support and resistance, including:
  • Pivot points: These calculate multiple support and resistance levels using the previous period's high, low, and closing price.
  • Moving averages: A moving average may serve as dynamic support when the price is above it and dynamic resistance when the price is below it.
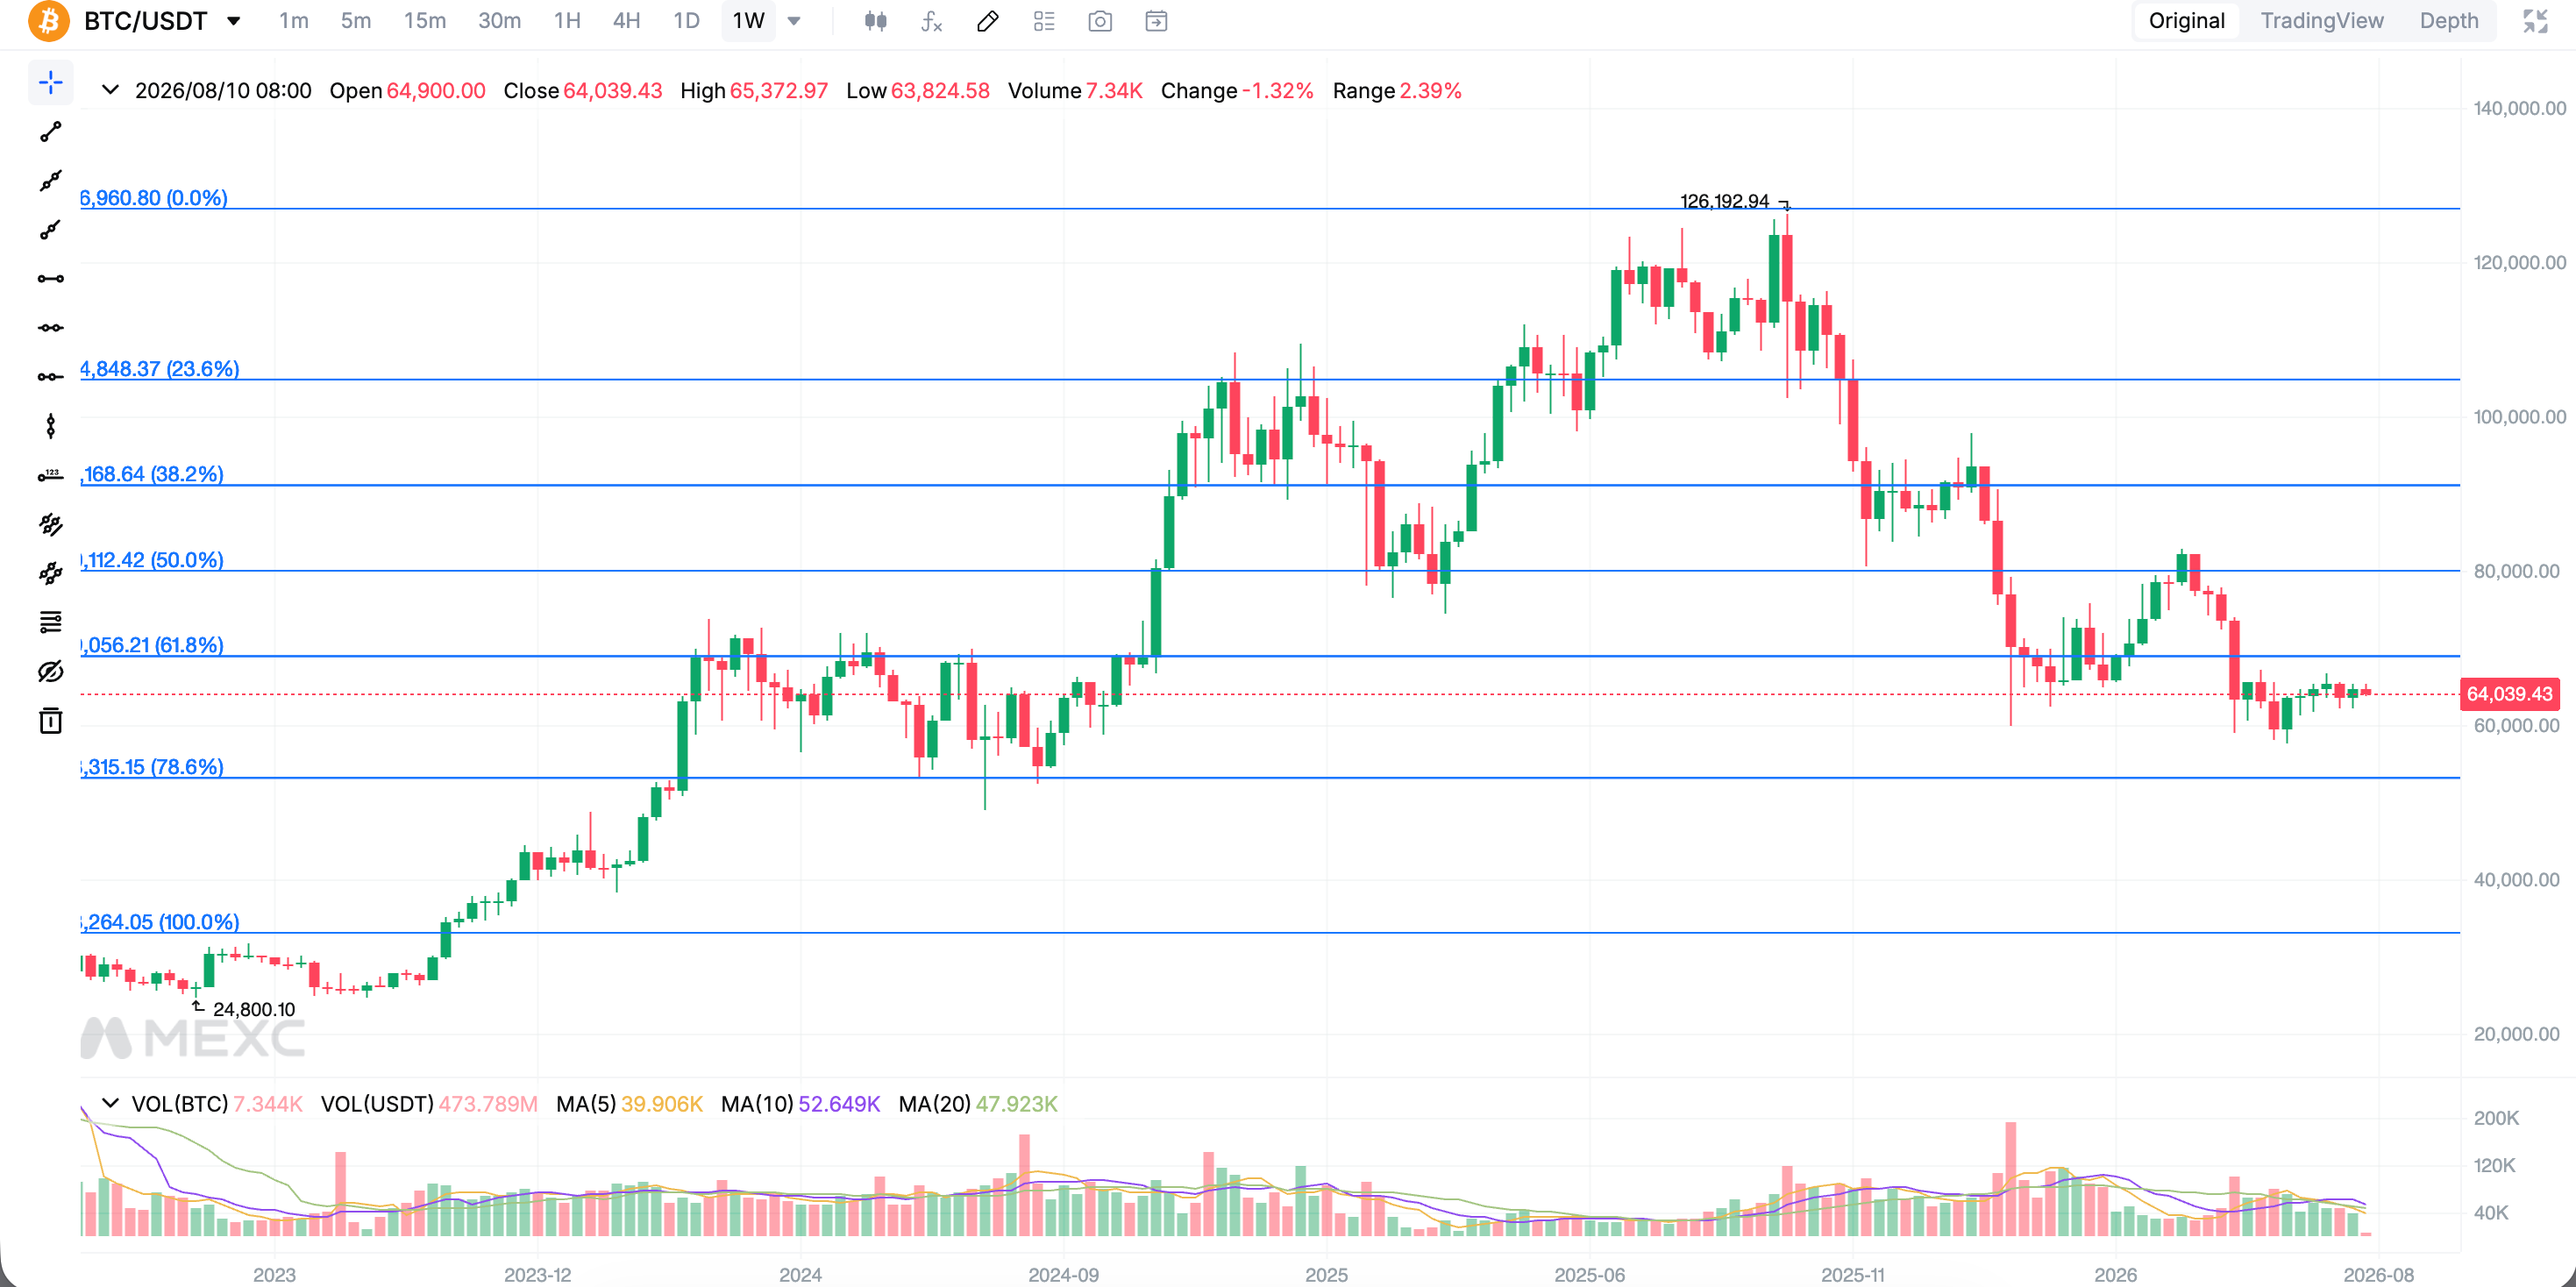
  • Fibonacci retracement: Key ratios such as 38.2%, 50%, and 61.8% often align with potential support and resistance zones.


3. How Support and Resistance Switch Roles


After the price breaks above a resistance level and continues to rise, the former resistance may become support. Market participants may treat the former resistance level as support when the price returns to it.

Conversely, after the price falls below support, the former support may become resistance during a subsequent rebound. A key level can therefore remain relevant even after it has been broken.

4. Support and Resistance Trading Strategies


4.1 Bounce Trading Strategy


Traders may buy when the price approaches support and begins to stabilize, anticipating a rebound. They may sell or reduce their position when the price approaches resistance, anticipating a pullback.

Before entering a trade, consider looking for confirmation from candlestick patterns such as hammers or engulfing patterns.

4.2 Breakout Trading Strategy


A high-volume move above resistance or below support may signal the beginning of a new trend. Traders may enter in the direction of the breakout and use the next key level as a potential target.

However, false breakouts can occur when the price briefly crosses a key level before quickly returning to its previous range. Waiting for a candlestick to close beyond the level may help confirm the breakout.

4.3 Setting Stop-Loss and Take-Profit Levels


Support and resistance can provide useful reference points for risk management. For a long position, traders may place a stop-loss slightly below support. For a short position, they may place a stop-loss slightly above resistance.

Resistance may serve as a take-profit target for a long position, while support may serve as a take-profit target for a short position. When trading Spot or Futures on MEXC, using these levels to set stop-loss and take-profit orders can help manage risk.

5. Important Considerations When Using Support and Resistance


1. Treat them as zones rather than exact prices. The market rarely reverses at precisely the same price each time. Allow some room above and below each key level.

2. Key levels can fail. Support and resistance are based on historical price behavior and do not guarantee future price reactions. Major news or sudden changes in market sentiment can cause the price to break through them.

3. Avoid relying on a single tool. Combine support and resistance analysis with trading volume, trendlines, candlestick patterns, and other technical tools.

4. Choose an appropriate timeframe. Support and resistance levels on daily and weekly charts may be more significant and suitable for swing trading. Shorter timeframes may be useful for day trading but tend to contain more market noise.

6. Support and Resistance FAQ


6.1 Which timeframe is best for identifying support and resistance?


It depends on your trading objective. Medium-term and long-term traders may prefer daily or weekly charts because levels on these timeframes may reflect more significant price history. Day traders may use charts ranging from 15 minutes to one hour while also referring to daily levels for the broader market direction.

6.2 Do traders use support and resistance?


Yes. Support and resistance are among the most widely used tools in technical analysis. Traders often combine them with trading volume and trend analysis when planning entries, exits, and risk management.

6.3 What is a support and resistance trading strategy?


There are two main approaches:
  1. A bounce strategy involves buying near support and selling near resistance.
  2. A breakout strategy involves entering in the direction of a high-volume move beyond a key level.

Stop-loss orders can be used with either strategy to help manage risk.

6.4 What market psychology is behind support and resistance?


Support and resistance can reflect how market participants respond to previously significant price levels. Traders who previously bought or sold at a particular price may respond similarly when the market returns to that level, creating a psychological barrier that can repeatedly affect price movements.

6.5 How can you assess the strength of support or resistance?


Consider three main factors: how often the price has tested the level, how long the level has remained relevant, and the trading volume during each test. More tests, a longer history, and higher-volume reactions may indicate a more significant level.


Risk Disclaimer: This content is for educational and informational purposes only and does not constitute financial, investment, or trading advice. Technical indicators are based on historical market data and cannot predict or guarantee future market performance. Digital asset trading involves significant risks and price volatility. Always conduct your own research and assess your risk tolerance before making any trading decisions.

How to Use Support and Resistance Levels in Trading: A Complete Beginner's Guide

Key Takeaways:

  • Support is an area where a falling price may stabilize or rebound, while resistance is an area where a rising price may stall or reverse.
  • Common ways to identify support and resistance include reviewing historical highs and lows, identifying price consolidation zones, and analyzing trading volume.
  • Support and resistance can switch roles. After a breakout, former resistance may become support.
  • Common strategies include trading bounces, trading breakouts, and placing stop-loss orders around support and resistance.
  • Support and resistance should be treated as price zones rather than exact levels and used alongside other technical tools.

1. What Are Support and Resistance?


Support is a price level where a falling market may stabilize and rebound. At this level, buying interest may begin to outweigh selling pressure, potentially slowing or reversing the decline. Support can be compared to a floor where the price may bounce off after reaching it.

Resistance is a price level where a rising market may stall or pull back. At this level, selling pressure may begin to outweigh buying interest as traders take profits or reduce their positions. Resistance can be compared to a ceiling that the price may struggle to break through.

For example, suppose a crypto asset has fallen to around $10,000 three times over the past six months and rebounded quickly each time. The $10,000 level could be considered strong support. If the asset has repeatedly approached $12,000 but failed to break above it, $12,000 could be considered a clear resistance level.

2. How to Identify Support and Resistance


You can use the candlestick charting tools on MEXC to draw and identify support and resistance levels using the following methods.

2.1 Review Historical Highs and Lows


Look for previous peaks and troughs where the price has reversed several times. The more often the price tests and reacts around the same level, the more reliable that level may be. As a general guideline, multiple reversal points around a similar price level, with some time between each test, can make the level more significant.

2.2 Identify Price Consolidation Zones


When the price trades within a narrow range for an extended period, that consolidation zone may later act as support or resistance. Many traders may have opened positions within the zone and could react similarly when the price returns to it.

2.3 Analyze Trading Volume


Trading volume can help traders assess the strength of support and resistance. A high-volume rebound near support or reversal near resistance may indicate stronger market participation and make the level more significant.

2.4 Use Technical Indicators


In addition to drawing horizontal lines manually, traders can use technical indicators to identify dynamic support and resistance, including:
  • Pivot points: These calculate multiple support and resistance levels using the previous period's high, low, and closing price.
  • Moving averages: A moving average may serve as dynamic support when the price is above it and dynamic resistance when the price is below it.
  • Fibonacci retracement: Key ratios such as 38.2%, 50%, and 61.8% often align with potential support and resistance zones.


3. How Support and Resistance Switch Roles


After the price breaks above a resistance level and continues to rise, the former resistance may become support. Market participants may treat the former resistance level as support when the price returns to it.

Conversely, after the price falls below support, the former support may become resistance during a subsequent rebound. A key level can therefore remain relevant even after it has been broken.

4. Support and Resistance Trading Strategies


4.1 Bounce Trading Strategy


Traders may buy when the price approaches support and begins to stabilize, anticipating a rebound. They may sell or reduce their position when the price approaches resistance, anticipating a pullback.

Before entering a trade, consider looking for confirmation from candlestick patterns such as hammers or engulfing patterns.

4.2 Breakout Trading Strategy


A high-volume move above resistance or below support may signal the beginning of a new trend. Traders may enter in the direction of the breakout and use the next key level as a potential target.

However, false breakouts can occur when the price briefly crosses a key level before quickly returning to its previous range. Waiting for a candlestick to close beyond the level may help confirm the breakout.

4.3 Setting Stop-Loss and Take-Profit Levels


Support and resistance can provide useful reference points for risk management. For a long position, traders may place a stop-loss slightly below support. For a short position, they may place a stop-loss slightly above resistance.

Resistance may serve as a take-profit target for a long position, while support may serve as a take-profit target for a short position. When trading Spot or Futures on MEXC, using these levels to set stop-loss and take-profit orders can help manage risk.

5. Important Considerations When Using Support and Resistance


1. Treat them as zones rather than exact prices. The market rarely reverses at precisely the same price each time. Allow some room above and below each key level.

2. Key levels can fail. Support and resistance are based on historical price behavior and do not guarantee future price reactions. Major news or sudden changes in market sentiment can cause the price to break through them.

3. Avoid relying on a single tool. Combine support and resistance analysis with trading volume, trendlines, candlestick patterns, and other technical tools.

4. Choose an appropriate timeframe. Support and resistance levels on daily and weekly charts may be more significant and suitable for swing trading. Shorter timeframes may be useful for day trading but tend to contain more market noise.

6. Support and Resistance FAQ


6.1 Which timeframe is best for identifying support and resistance?


It depends on your trading objective. Medium-term and long-term traders may prefer daily or weekly charts because levels on these timeframes may reflect more significant price history. Day traders may use charts ranging from 15 minutes to one hour while also referring to daily levels for the broader market direction.

6.2 Do traders use support and resistance?


Yes. Support and resistance are among the most widely used tools in technical analysis. Traders often combine them with trading volume and trend analysis when planning entries, exits, and risk management.

6.3 What is a support and resistance trading strategy?


There are two main approaches:
  1. A bounce strategy involves buying near support and selling near resistance.
  2. A breakout strategy involves entering in the direction of a high-volume move beyond a key level.

Stop-loss orders can be used with either strategy to help manage risk.

6.4 What market psychology is behind support and resistance?


Support and resistance can reflect how market participants respond to previously significant price levels. Traders who previously bought or sold at a particular price may respond similarly when the market returns to that level, creating a psychological barrier that can repeatedly affect price movements.

6.5 How can you assess the strength of support or resistance?


Consider three main factors: how often the price has tested the level, how long the level has remained relevant, and the trading volume during each test. More tests, a longer history, and higher-volume reactions may indicate a more significant level.


Risk Disclaimer: This content is for educational and informational purposes only and does not constitute financial, investment, or trading advice. Technical indicators are based on historical market data and cannot predict or guarantee future market performance. Digital asset trading involves significant risks and price volatility. Always conduct your own research and assess your risk tolerance before making any trading decisions.