

How to Use the ADTM Indicator in U.S. Stock Trading: A Complete Beginner's Guide
Key Takeaways:
- The ADTM indicator compares upward and downward price movements relative to opening prices to assess the balance of buying and selling momentum.
- The indicator ranges from −1 to +1. Readings below −0.5 are conventionally described as a "low-risk zone," while readings above 0.5 are described as a "high-risk zone." These labels are reference points, not measures of actual investment risk.
- Crossovers between ADTM and its moving average are its main trading signals: a crossover above may indicate a buying opportunity, while a crossover below may indicate a selling opportunity.
- The classic ADTM settings use a 23-day summation period and an 8-day signal moving average, with the indicator generally used on daily charts and higher timeframes.
- MEXC users can combine ADTM with price-volume analysis, support and resistance levels, and build a more comprehensive trading approach.
1. What Is the ADTM Indicator?
The Adaptive Dynamic Trading Money Flow Index (ADTM) is a technical indicator used to analyze momentum and potential reversals. It compares upward and downward price movements relative to opening prices to assess the balance of buying and selling momentum. By considering changes in opening prices and subsequent price movements, it expresses this balance within a fixed range of −1 to +1.
Unlike oscillators that rely primarily on closing prices, ADTM focuses on the opening price relative to the previous trading day's opening price, as well as the day's high and low. This approach can help traders examine intraday changes in price momentum and identify potential weakening in buying or selling pressure.
2. How to Interpret ADTM Trading Signals
Moving average crossovers: When ADTM crosses above its moving average, it forms a golden cross, which may indicate a buying opportunity. When it crosses below its moving average, it forms a death cross, which may indicate a selling opportunity.
High-risk zone: A reading above 0.5 falls within what is conventionally called the high-risk zone. It suggests strong upward momentum that may leave prices vulnerable to a pullback. Traders may consider taking profits or reducing exposure rather than chasing rising prices.
Low-risk zone: A reading below −0.5 falls within what is conventionally called the low-risk zone. It suggests strong downward momentum that may be approaching exhaustion. Traders may watch for signs that prices are stabilizing or reversing before considering gradual entries; the zone label does not mean that buying is inherently low risk.
Zero-line signals: The zero line separates positive and negative readings. Values above zero indicate stronger buying momentum, while values below zero indicate stronger selling momentum. Crossings around zero may suggest a shift in that balance.
In practice, beginners can consider these signals together. For example, a golden cross in the low-risk zone may provide a stronger potential buying signal than a crossover alone. A death cross in the high-risk zone may provide a stronger potential selling signal.
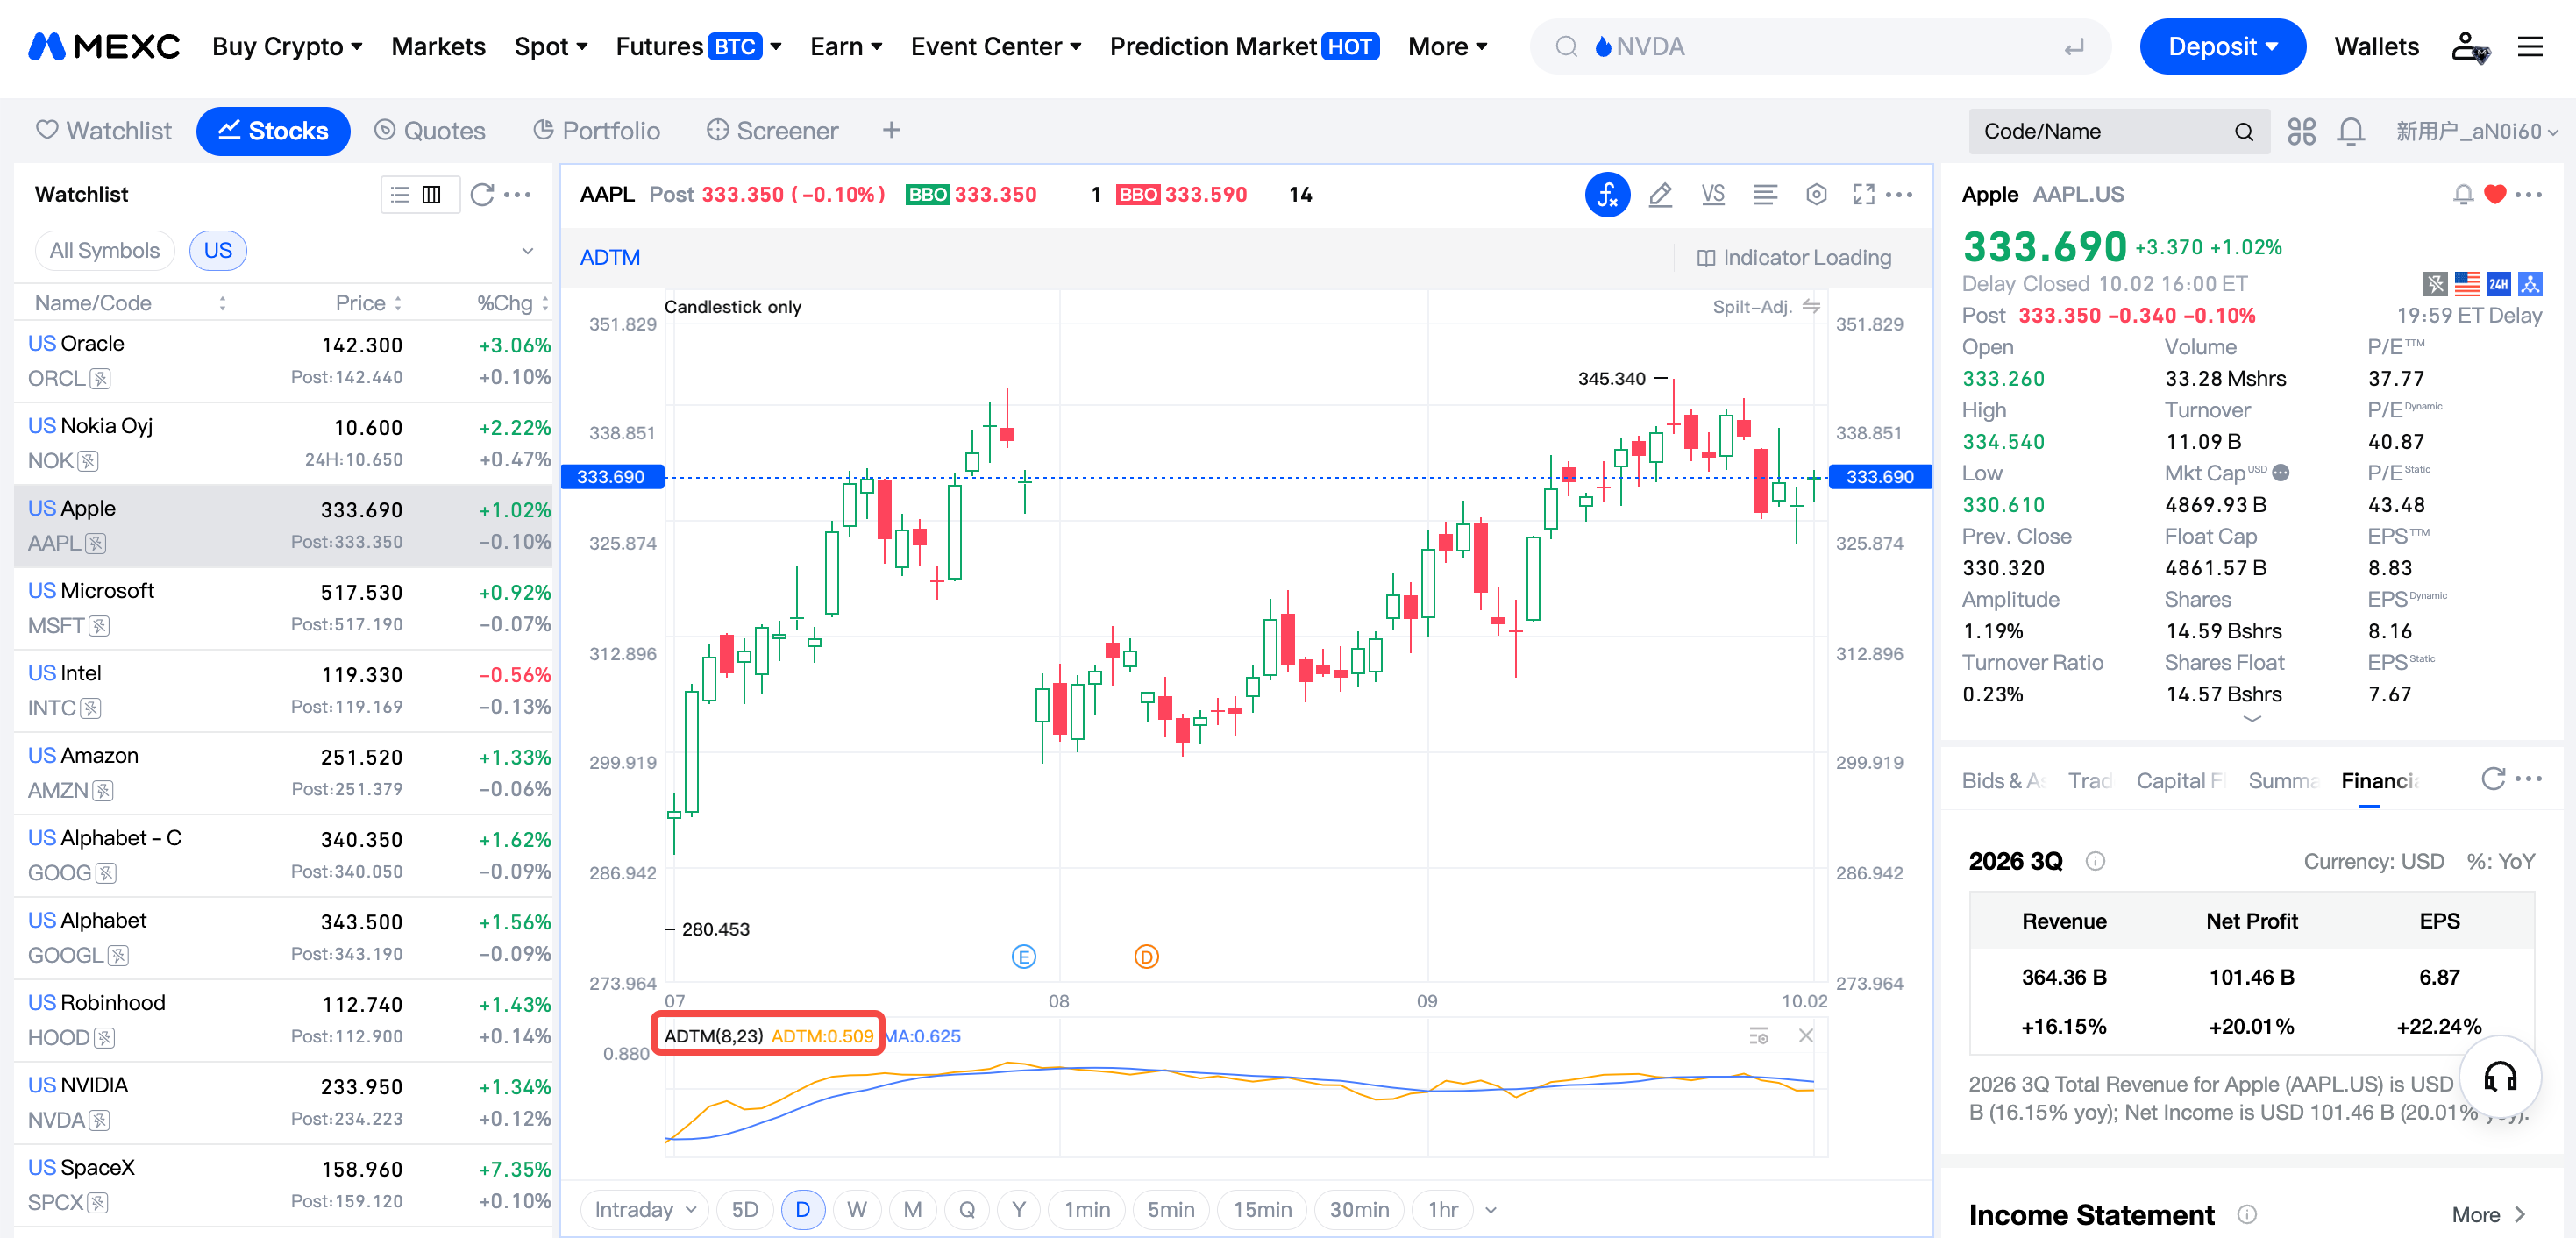
3. Practical Tips for Using ADTM on MEXC
ADTM can be applied across markets, including U.S. stocks, cryptocurrencies, commodity futures, and forex. Consider the following principles when using it:
1) Prioritize daily charts and higher timeframes to help filter out intraday market noise during consolidation.
2) When using shorter timeframes, such as 1-hour or 4-hour charts, consider the broader trend on higher timeframes.
3) Assess crossovers alongside the indicator's position within its reference zones, rather than chasing upward moves in the high-risk zone.
4) Combine indicator signals with price and volume analysis, key support and resistance levels, and disciplined money management.
The charting tools available for U.S. stocks on MEXC allow users to examine price structure and cross-check it against indicator signals.
4. Advantages and Limitations of ADTM
Advantages of ADTM: Its opening-price-based approach helps traders assess intraday momentum and identify potential exhaustion in buying or selling pressure. Its moving average crossovers and defined upper and lower reference zones provide a clear framework that can be accessible to beginners.
Limitations of ADTM: No technical indicator can predict market movements with complete accuracy. During strong directional trends, readings can remain in the high-risk or low-risk zones for extended periods, and crossovers may reverse repeatedly. MEXC encourages users to incorporate ADTM into a broader trading system and apply appropriate position sizing and risk management.
5. ADTM Indicator FAQ
5.1 What is the ADTM indicator?
ADTM, also known as the Adaptive Dynamic Trading Money Flow Index, compares upward and downward price movements relative to opening prices to assess buying and selling momentum. Its readings range from −1 to +1.
5.2 How do I read ADTM trading signals?
A crossover above the moving average may indicate a buying opportunity, while a crossover below may indicate a selling opportunity. Readings below −0.5 fall within the conventional low-risk zone, where traders may watch for potential buying opportunities. Readings above 0.5 fall within the high-risk zone, where traders should be alert to potential pullbacks.
5.3 How does ADTM differ from the AD indicator?
The Accumulation/Distribution (AD) line combines volume with the closing price's position within the day's price range. ADTM instead uses price movements relative to opening prices and changes from the previous day's opening price, focusing on buying and selling momentum after the market opens.
5.4 What are the best ADTM settings?
The classic default settings use a 23-day summation period and an 8-day signal moving average. Beginners can start with these settings and adjust them to suit their trading timeframe as they become more familiar with the indicator.
5.5 What does ADT mean in time references? Is it related to ADTM?
In time references, ADT usually stands for Atlantic Daylight Time. It is a time zone abbreviation and is unrelated to the ADTM trading indicator.