क्रिप्टो खरीदें
मार्केट
स्पॉट
फ़्यूचर्सBTC
कमाएँ
इवेंट सेंटर
रिवॉर्ड हब
अधिक
How to Use the Bias Ratio (BIAS) in Trading: A Complete Beginner's GuideHow to Use the Bias Ratio (BIAS) in Trading: A Complete Beginner's Guide
कैटेगरी की लिस्ट
कैंसिल करें

How to Use the Bias Ratio (BIAS) in Trading: A Complete Beginner's Guide

Key Takeaways:

  • The Bias Ratio (BIAS) measures the percentage deviation between the current price and its moving average.
  • Based on the mean reversion concept, BIAS helps identify potential overbought and oversold conditions.
  • A high positive BIAS may indicate overheating and potential pullbacks, while a deeply negative BIAS may suggest possible rebounds.
  • BIAS works best when combined with other indicators, such as Bollinger Bands and Stochastic Oscillator, to improve analysis accuracy.
  • MEXC users can add the BIAS indicator directly from chart tools to support trading decisions.

1. What Is the Bias Ratio (BIAS)?


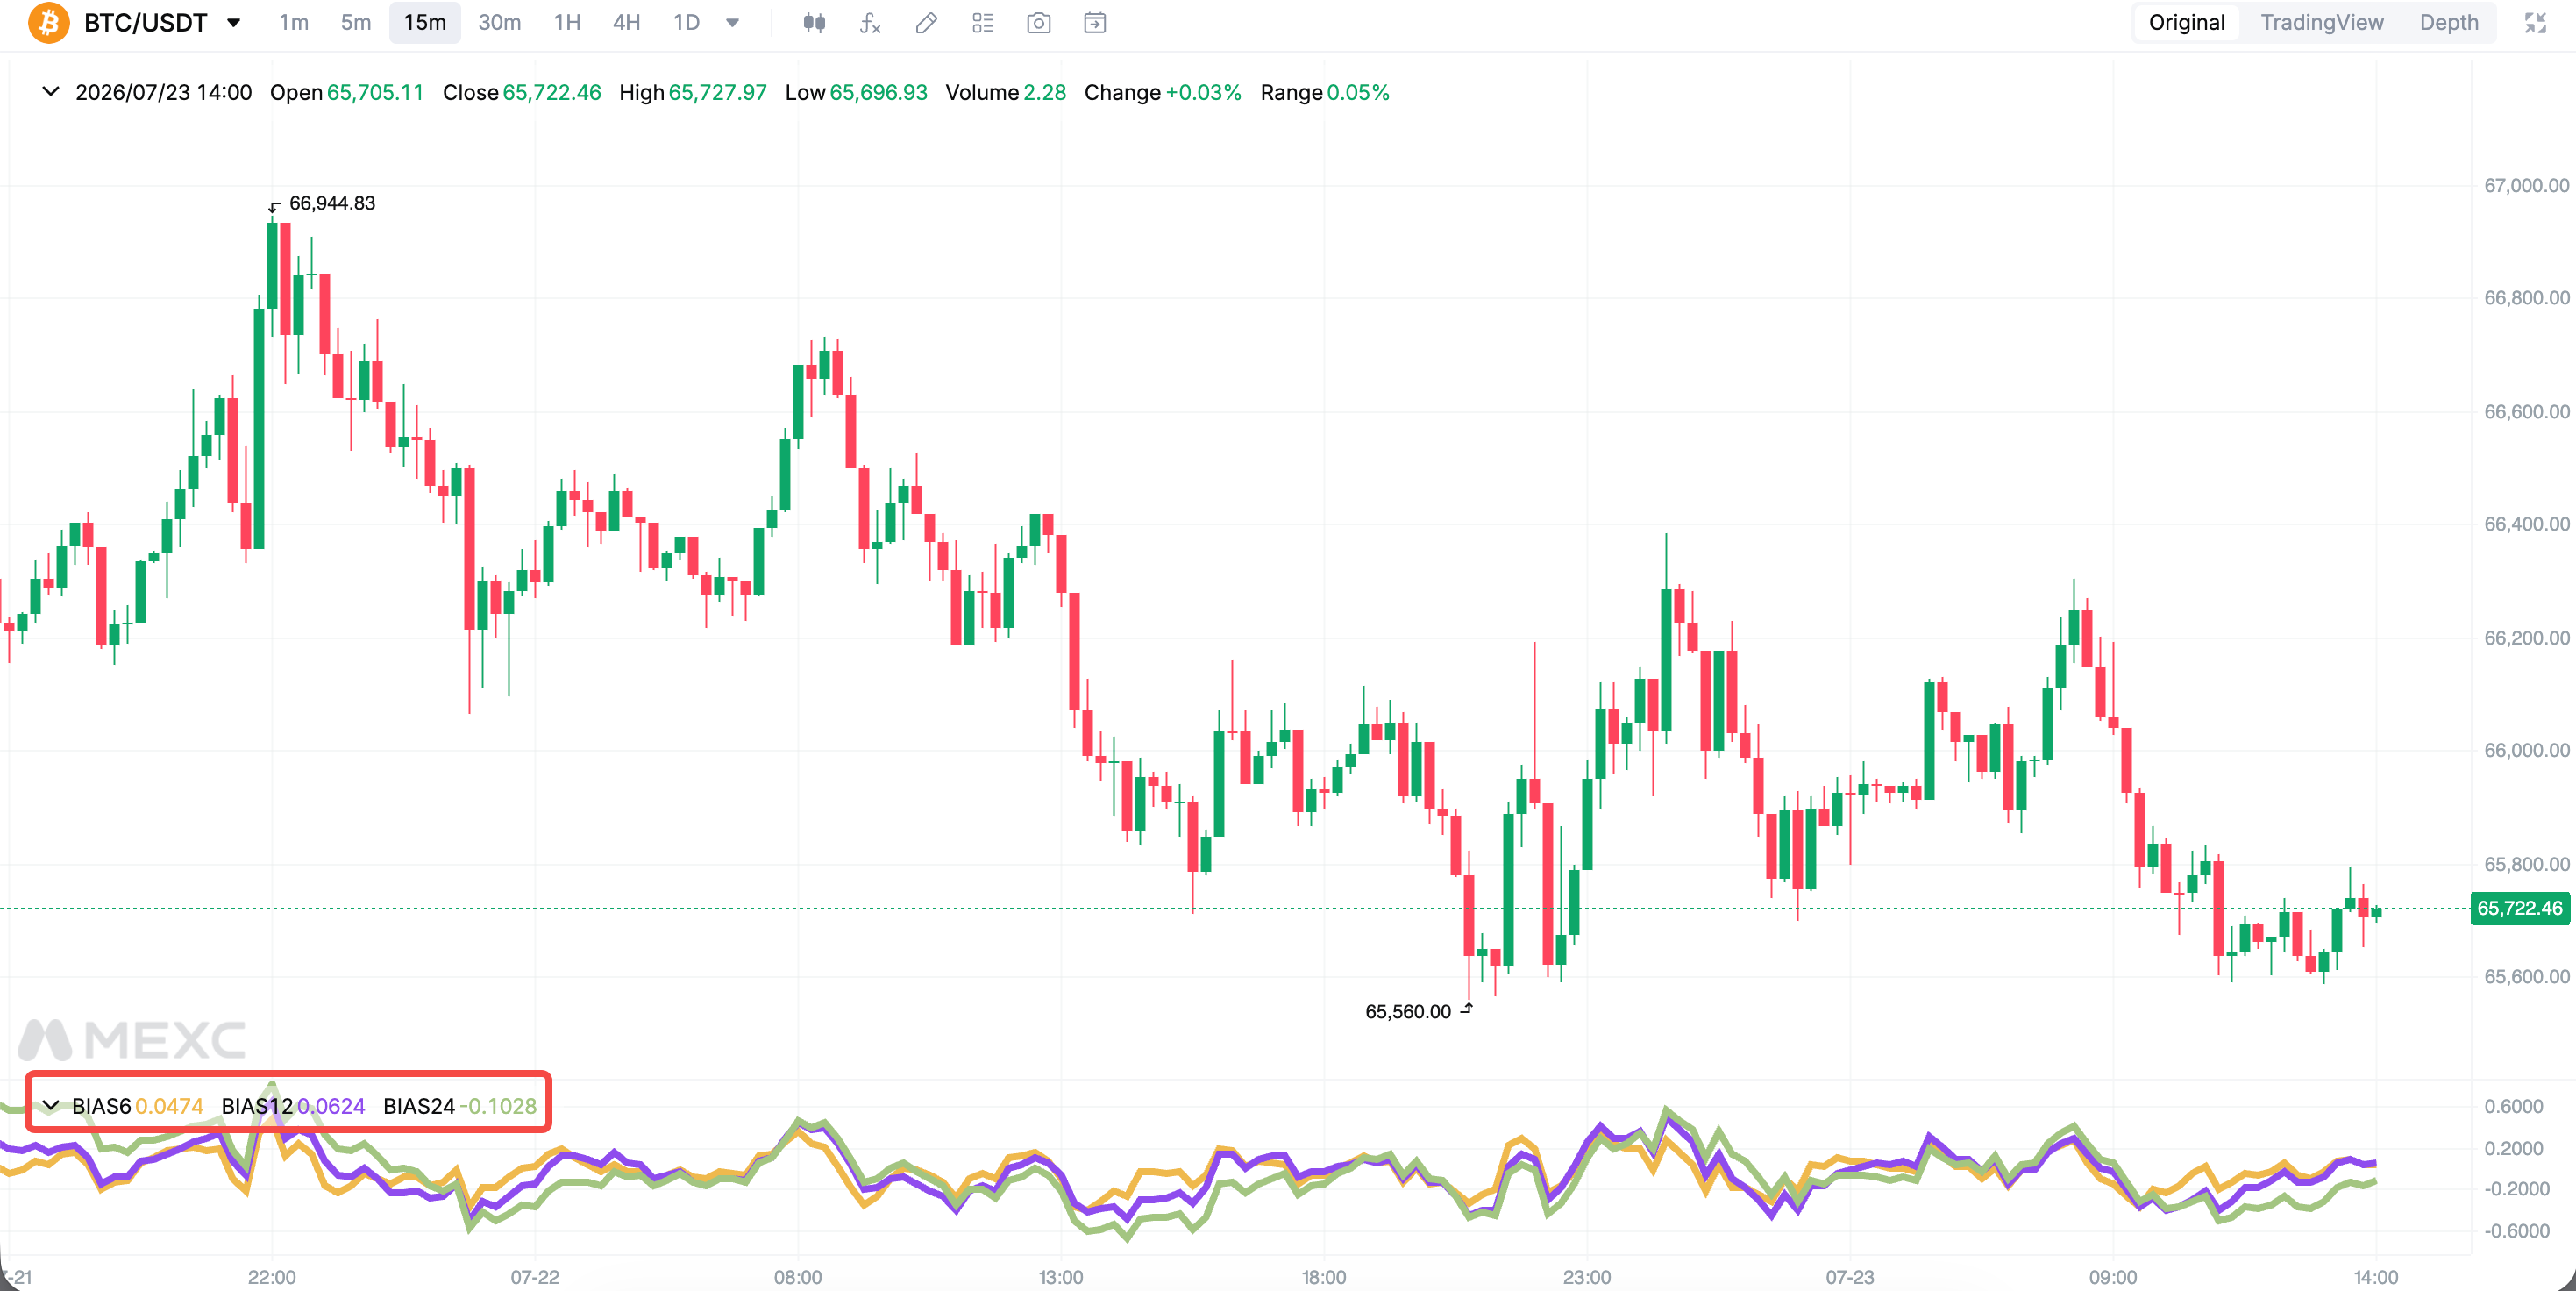
The Bias Ratio (BIAS) is a technical analysis indicator that measures how far the current price deviates from its moving average over a selected period. It is displayed as a percentage and helps traders evaluate whether an asset may be overextended.

BIAS is built on the concept of mean reversion. When prices move significantly away from their moving average, the likelihood of a correction or rebound may increase. When prices remain close to the moving average, the market may be in a more balanced state.

For MEXC traders, BIAS is a simple and beginner-friendly tool that can help identify whether short-term market conditions appear overheated or oversold.

2. Interpreting Positive and Negative BIAS


BIAS can be positive, negative, or close to zero:

Positive BIAS: When the current price is above the moving average, BIAS is positive. A significantly high positive value may suggest that the asset is overbought and could face a potential pullback.

Negative BIAS:When the current price is below the moving average, BIAS is negative. An extremely low value may indicate oversold conditions and a possible rebound opportunity.

Near Zero:When BIAS stays close to zero, the price is trading near its moving average, indicating limited directional momentum and no clear market trend.

3. How to Use BIAS on MEXC


Go to MEXC official website → Spot/Futures → Indicators → BIAS

Users can add the BIAS indicator through MEXC chart settings and adjust parameters based on their trading preferences.


In practice, users can consider the following approaches:

1) Set Reference Levels Set upper and lower BIAS levels based on historical price movements. Extreme positive or negative values may indicate potential reversal areas.

2) Monitor Crossover Signals Some traders add a moving average line to the BIAS line. A crossover above the moving average may be viewed as a potential buying signal, while a crossover below may indicate weakening momentum.

3) Risk Management BIAS should not be used as a standalone signal. In strong market trends, prices may remain at extreme BIAS levels for extended periods. Combine BIAS with other indicators and risk management strategies.

4. Combining BIAS With Other Indicators


BIAS may generate unclear signals when used alone, especially in sideways or strong trending markets. Combining it with other indicators can improve analysis.

1) BIAS + Bollinger Bands:Combining BIAS with Bollinger Bands can help traders identify potential entry and exit opportunities. When Bollinger Bands narrow, it may signal that a breakout is approaching.

2) BIAS + Stochastic Oscillator: BIAS identifies potential overbought and oversold conditions, while the Stochastic Oscillator helps evaluate momentum and trend direction.

3) BIAS + Trend Indicators:Using BIAS with trend indicators such as MACD can help traders avoid counter-trend decisions during strong market moves.

5. BIAS FAQ


5.1 What is BIAS?


BIAS measures the percentage deviation between the current price and its moving average to evaluate potential overbought and oversold conditions.

5.2 How should BIAS values be interpreted?

Positive values indicate the price is above the moving average, while negative values indicate it is below. Larger deviations may suggest stronger overbought or oversold conditions.

5.3 Is BIAS always accurate?

No single indicator can predict market movements with certainty. BIAS may work better in range-bound markets but can be less reliable during strong trends. It should be combined with other analysis tools.

5.4 How should I choose a BIAS period?

Short-term trading often uses 5- or 10-periods, medium-term trading typically uses 20- or 30-periods, and long-term trading may use 60-periods or longer. Shorter periods react faster, while longer periods provide smoother signals.

5.5 How do I use BIAS on MEXC?

Open the chart indicator settings, search for BIAS, and add it to your chart. Users can adjust the period and display settings based on their strategy.

The Bias Ratio (BIAS) is a simple technical indicator that helps traders measure price deviation from moving averages and identify potential pullback and rebound opportunities.

However, BIAS should not be used alone. Traders should combine it with other technical indicators and apply proper risk management when making trading decisions on MEXC.


Risk Disclaimer: Technical indicators are based on historical data and are provided for reference only. They do not guarantee future market performance or trading results. Digital asset markets are highly volatile and involve significant risks. Please evaluate your own risk tolerance, conduct independent research, and make informed trading decisions.

How to Use the Bias Ratio (BIAS) in Trading: A Complete Beginner's Guide

Key Takeaways:

  • The Bias Ratio (BIAS) measures the percentage deviation between the current price and its moving average.
  • Based on the mean reversion concept, BIAS helps identify potential overbought and oversold conditions.
  • A high positive BIAS may indicate overheating and potential pullbacks, while a deeply negative BIAS may suggest possible rebounds.
  • BIAS works best when combined with other indicators, such as Bollinger Bands and Stochastic Oscillator, to improve analysis accuracy.
  • MEXC users can add the BIAS indicator directly from chart tools to support trading decisions.

1. What Is the Bias Ratio (BIAS)?


The Bias Ratio (BIAS) is a technical analysis indicator that measures how far the current price deviates from its moving average over a selected period. It is displayed as a percentage and helps traders evaluate whether an asset may be overextended.

BIAS is built on the concept of mean reversion. When prices move significantly away from their moving average, the likelihood of a correction or rebound may increase. When prices remain close to the moving average, the market may be in a more balanced state.

For MEXC traders, BIAS is a simple and beginner-friendly tool that can help identify whether short-term market conditions appear overheated or oversold.


2. Interpreting Positive and Negative BIAS


BIAS can be positive, negative, or close to zero:

Positive BIAS: When the current price is above the moving average, BIAS is positive. A significantly high positive value may suggest that the asset is overbought and could face a potential pullback.

Negative BIAS:When the current price is below the moving average, BIAS is negative. An extremely low value may indicate oversold conditions and a possible rebound opportunity.

Near Zero:When BIAS stays close to zero, the price is trading near its moving average, indicating limited directional momentum and no clear market trend.

3. How to Use BIAS on MEXC


Go to MEXC official website → Spot/Futures → Indicators → BIAS

Users can add the BIAS indicator through MEXC chart settings and adjust parameters based on their trading preferences.


In practice, users can consider the following approaches:

1) Set Reference Levels Set upper and lower BIAS levels based on historical price movements. Extreme positive or negative values may indicate potential reversal areas.

2) Monitor Crossover Signals Some traders add a moving average line to the BIAS line. A crossover above the moving average may be viewed as a potential buying signal, while a crossover below may indicate weakening momentum.

3) Risk Management BIAS should not be used as a standalone signal. In strong market trends, prices may remain at extreme BIAS levels for extended periods. Combine BIAS with other indicators and risk management strategies.

4. Combining BIAS With Other Indicators


BIAS may generate unclear signals when used alone, especially in sideways or strong trending markets. Combining it with other indicators can improve analysis.

1) BIAS + Bollinger Bands:Combining BIAS with Bollinger Bands can help traders identify potential entry and exit opportunities. When Bollinger Bands narrow, it may signal that a breakout is approaching.

2) BIAS + Stochastic Oscillator: BIAS identifies potential overbought and oversold conditions, while the Stochastic Oscillator helps evaluate momentum and trend direction.

3) BIAS + Trend Indicators:Using BIAS with trend indicators such as MACD can help traders avoid counter-trend decisions during strong market moves.

5. BIAS FAQ


5.1 What is BIAS?


BIAS measures the percentage deviation between the current price and its moving average to evaluate potential overbought and oversold conditions.

5.2 How should BIAS values be interpreted?

Positive values indicate the price is above the moving average, while negative values indicate it is below. Larger deviations may suggest stronger overbought or oversold conditions.

5.3 Is BIAS always accurate?

No single indicator can predict market movements with certainty. BIAS may work better in range-bound markets but can be less reliable during strong trends. It should be combined with other analysis tools.

5.4 How should I choose a BIAS period?

Short-term trading often uses 5- or 10-periods, medium-term trading typically uses 20- or 30-periods, and long-term trading may use 60-periods or longer. Shorter periods react faster, while longer periods provide smoother signals.

5.5 How do I use BIAS on MEXC?

Open the chart indicator settings, search for BIAS, and add it to your chart. Users can adjust the period and display settings based on their strategy.

The Bias Ratio (BIAS) is a simple technical indicator that helps traders measure price deviation from moving averages and identify potential pullback and rebound opportunities.

However, BIAS should not be used alone. Traders should combine it with other technical indicators and apply proper risk management when making trading decisions on MEXC.


Risk Disclaimer: Technical indicators are based on historical data and are provided for reference only. They do not guarantee future market performance or trading results. Digital asset markets are highly volatile and involve significant risks. Please evaluate your own risk tolerance, conduct independent research, and make informed trading decisions.