क्रिप्टो खरीदें
मार्केट
स्पॉट
फ़्यूचर्सBTC
कमाएँ
इवेंट सेंटर
रिवॉर्ड हब
अधिक
How to Use the Commodity Channel Index (CCI) in Trading: A Complete Beginner's GuideHow to Use the Commodity Channel Index (CCI) in Trading: A Complete Beginner's Guide
कैटेगरी की लिस्ट
कैंसिल करें

How to Use the Commodity Channel Index (CCI) in Trading: A Complete Beginner's Guide

Key Takeaways

  • The Commodity Channel Index (CCI) is an unbounded momentum oscillator that measures how far an asset's current price has moved from its historical average.
  • Readings above +100 may indicate strong bullish momentum, while readings below -100 may indicate strong bearish momentum or oversold conditions.
  • Common CCI settings use 14 or 20 periods, but the appropriate setting depends on the market, timeframe, and trading style.
  • Traders commonly use CCI to analyze overbought and oversold conditions, zero-line crossovers, and bullish or bearish divergence.
  • CCI is based on historical price data and should not be used alone. Traders should seek confirmation from price action, trend tools, volume, or other momentum indicators and apply appropriate risk controls.

1. What Is the Commodity Channel Index?


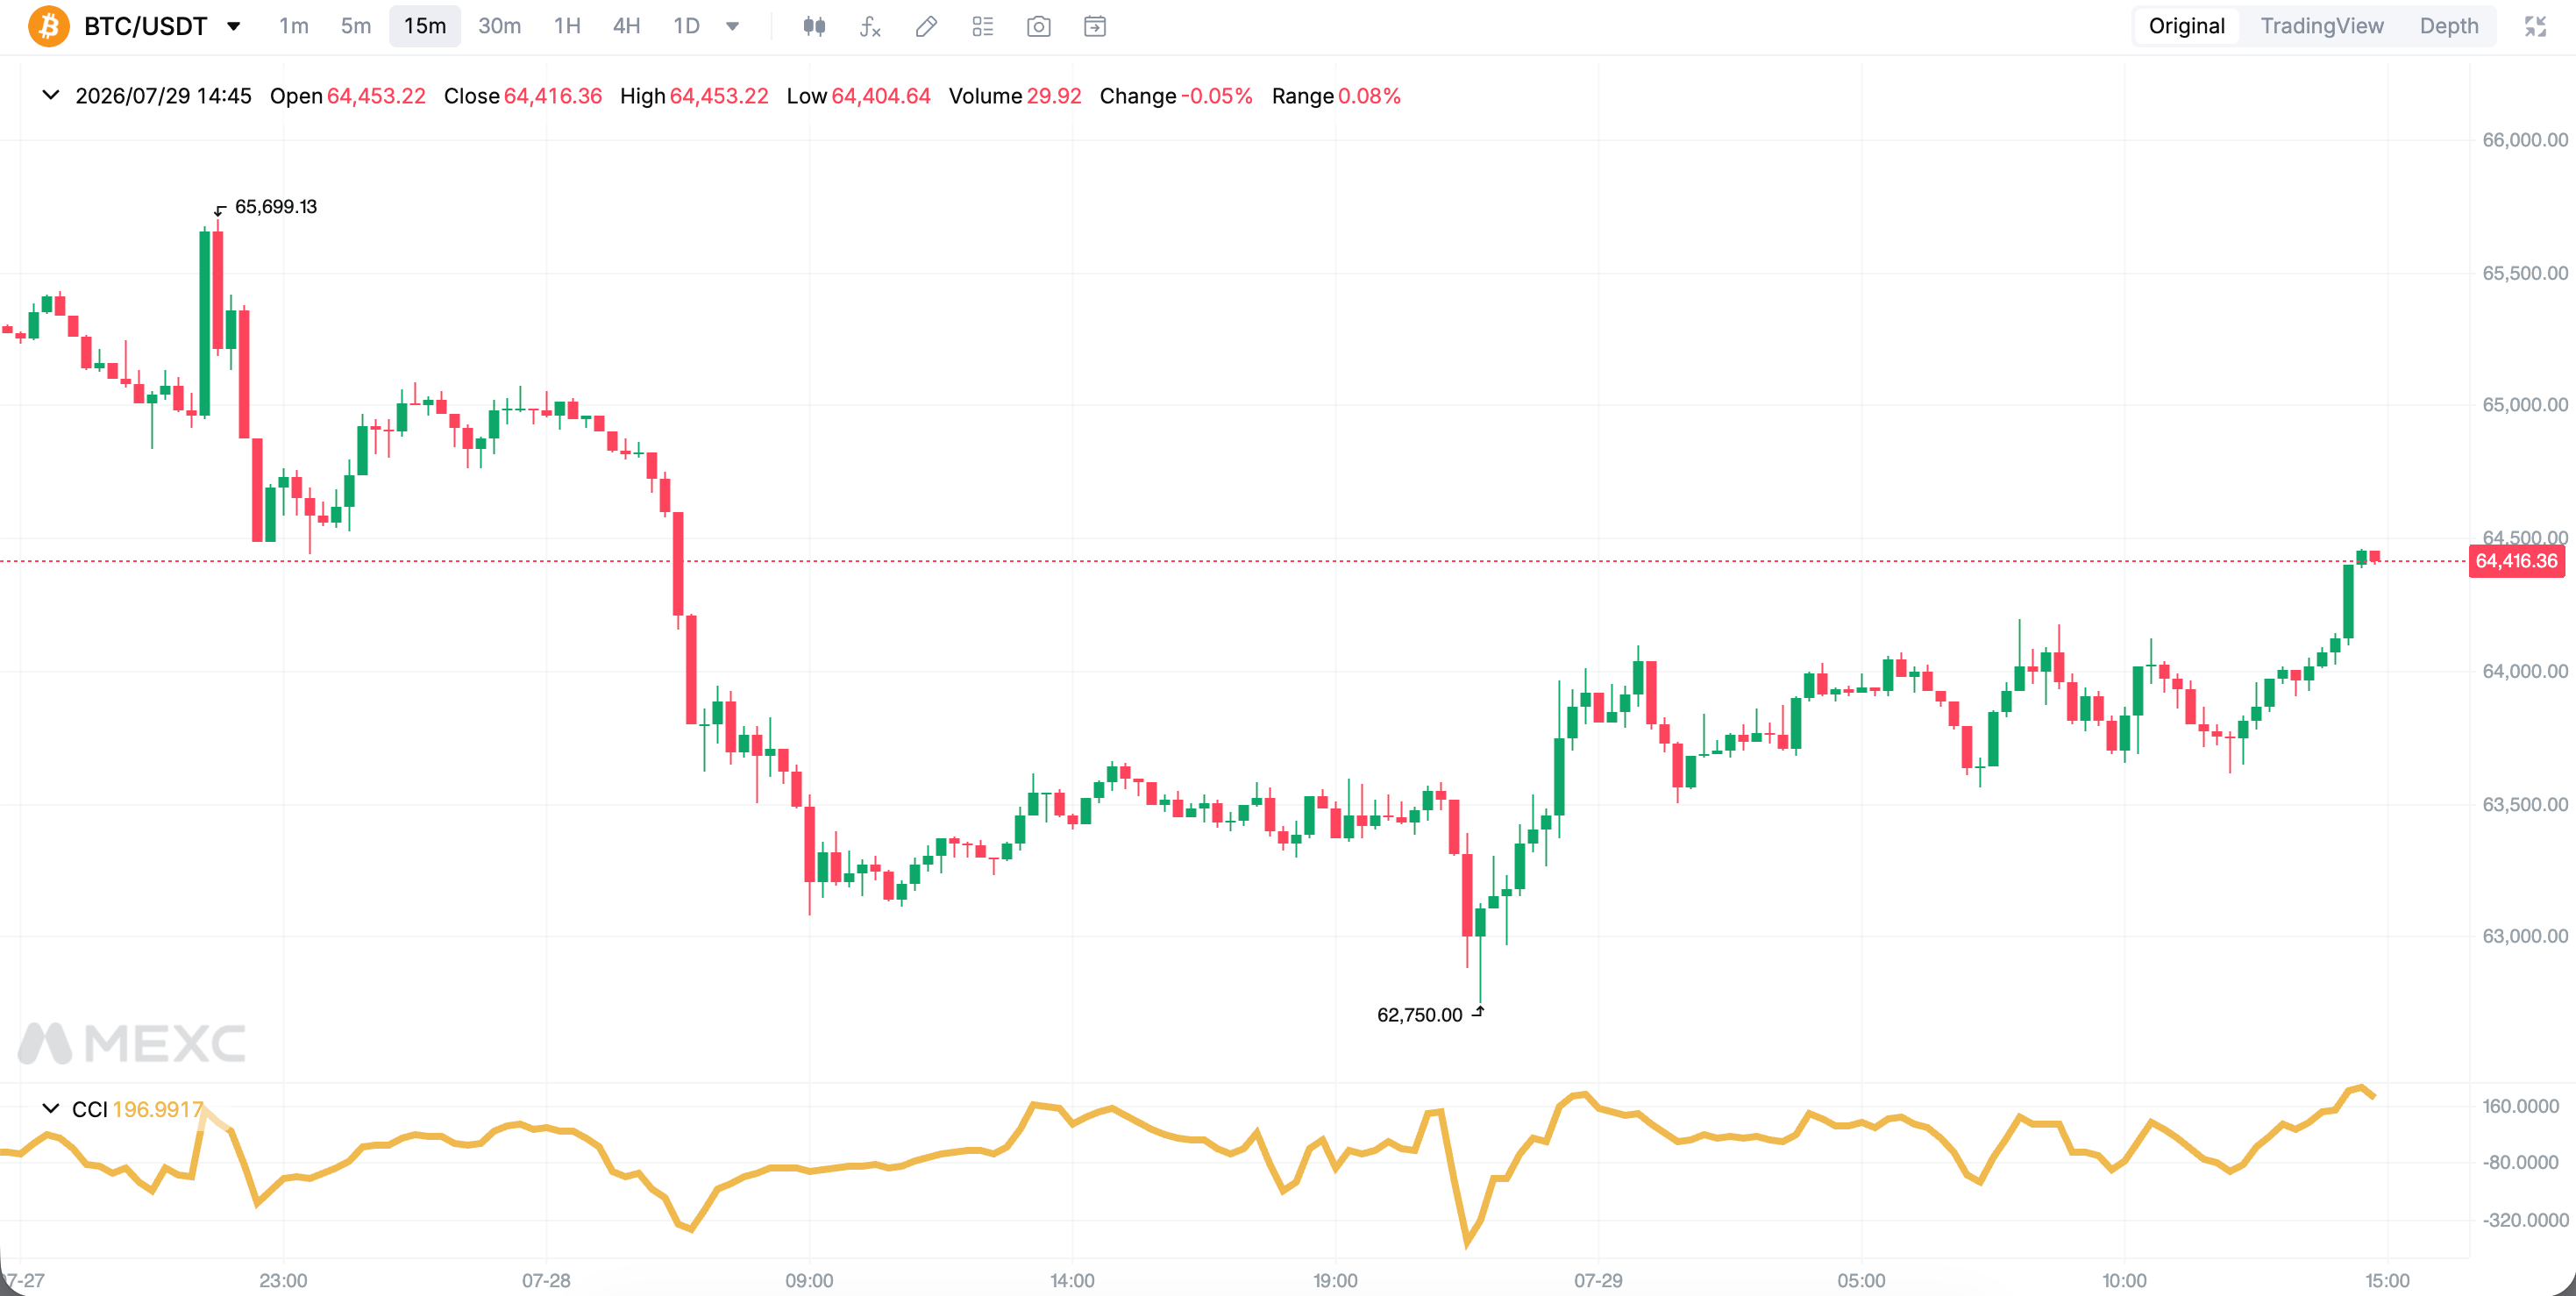
The Commodity Channel Index (CCI) is a momentum oscillator first introduced by technical analyst Donald Lambert in 1980. It measures the difference between an asset's current price and its average price over a selected number of periods. In simple terms, CCI helps traders assess whether price has moved unusually far above or below its recent average.

A high CCI reading means the current price is well above its historical average and may reflect strong upward momentum or an overbought market. A low reading means price is well below its average and may reflect a downtrend or oversold conditions. These readings describe current momentum; they do not guarantee the next price movement.

Unlike the Relative Strength Index (RSI), CCI has no fixed upper or lower boundary. Approximately 70% to 80% of CCI readings typically remain between -100 and +100, while around 20% to 30% move outside this range. Traders often watch these outer zones for potential momentum or reversal signals.

2. What Are the Best CCI Settings?


There is no universally best CCI setting. The most common settings are 14 or 20 periods, but the choice affects how quickly the indicator responds to price changes.

Shorter settings, such as fewer than 14 periods: CCI reacts more quickly, produces more frequent signals, and spends less time within the -100 to +100 range. This may suit short-term or scalping strategies, but it can also generate more market noise and false signals.

Longer settings, such as more than 20 periods: CCI becomes smoother and may produce more stable signals. This can be useful for medium- or longer-term trend analysis, although the indicator will respond more slowly to new price movements.

In highly volatile cryptocurrency markets, some traders use wider reference levels, such as ±200, to identify more extreme readings. Beginners are advised to test different settings in a simulated environment before using them in live trading. The selected period and threshold should match the asset's volatility, the chart timeframe, and the trader's risk tolerance.


3. How to Use CCI in Trading


CCI can support several forms of market analysis, but each signal should be interpreted within the broader trend and confirmed with other evidence. The following three approaches are among the most common.

3.1 Overbought and oversold signals


When CCI crosses above +100, price is significantly above its recent average. This may indicate strengthening bullish momentum. When CCI crosses below -100, it may indicate strengthening bearish momentum or oversold conditions. Neither crossover should be treated as an automatic instruction to enter a trade.

In short-term trading, a move below -100 followed by a recovery above -100 may provide a potential bullish setup. Similarly, when CCI rises above +100 and later falls back below it, traders may consider whether upward momentum is weakening. Price structure, volume, or a trend indicator can provide additional confirmation before an entry or exit.

Because CCI is unbounded, it can remain at an elevated or depressed level during a strong trend. A market that appears overbought may continue rising, while an oversold market may continue falling. Traders should therefore avoid relying on the threshold alone and may use stop-loss orders or smaller position sizes to manage risk.

3.2 Zero-line crossovers


CCI oscillates around a zero line, which represents the relationship between current price and its moving average. A crossover above zero may indicate that momentum has turned positive, while a crossover below zero may indicate that momentum has turned negative.

Zero-line crossovers can help traders identify the early stages of a potential trend, especially when they align with a breakout or a change in market structure. In a sideways market, however, CCI may cross the zero line repeatedly and generate false signals. Waiting for a candle close or confirming the move with trend and volume indicators may reduce premature entries.

3.3 Bullish and bearish divergence


Divergence occurs when price and CCI move in different directions. If price reaches a new low while CCI forms a higher low, a bullish divergence may be developing. This can suggest that downward momentum is weakening and that an upward reversal may become possible.

If price reaches a new high while CCI forms a lower high, a bearish divergence may indicate weakening upward momentum and a possible downside reversal. Divergence can persist before price changes direction, so traders should wait for confirmation from price action, support or resistance, volume, or another momentum indicator. A divergence signal alone does not confirm that a reversal will occur.

4. CCI vs. RSI: What is the difference?


CCI and RSI are both momentum oscillators, but they measure different aspects of price behavior. RSI is bounded between 0 and 100 and commonly uses 70 and 30 as overbought and oversold reference levels. CCI has no fixed range and commonly uses +100 and -100 as its main reference levels.

CCI measures how far the current price has moved from its recent average price, making it useful for identifying extreme deviations and changes in trend momentum. RSI measures the speed and magnitude of recent price changes and may provide more stable readings in range-bound markets.

Feature
CCI
RSI
Range
Unbounded
0 to 100
Common Levels
+100 and -100
70 and 30
Primary Focus
Price deviation from its average
Speed and magnitude of price changes
Typical Use
Trend strength and extreme price deviation
Momentum analysis in trending or range-bound markets

Neither indicator is universally better. The appropriate choice depends on the market environment, timeframe, and trading strategy. Traders may also use CCI and RSI together to compare momentum signals, but agreement between two indicators still does not guarantee a successful trade.

5. Commodity Channel Index FAQ


5.1 What is the CCI indicator?


CCI is a momentum oscillator that compares an asset's current price with its historical average. Traders use it to analyze unusually strong or weak price movements, overbought or oversold conditions, and potential changes in trend momentum.

5.2 What are the best CCI settings?


There is no single best setting for every market. Common settings are 14 or 20 periods. Shorter settings respond faster but may generate more noise, while longer settings are smoother but more delayed. In highly volatile markets, some traders use ±200 reference levels, but any adjustment should be tested against the asset, timeframe, and trading style.

5.3 How can I use CCI on MEXC?


Navigation: MEXC website → Spot or Futures → Indicators → CCI

5.4 Is CCI better than RSI?


No indicator is universally better. CCI is unbounded and may respond more strongly to price deviations and trend acceleration. RSI has a fixed 0–100 range and may be easier to interpret in range-bound markets. The choice depends on the trader's timeframe, market conditions, and strategy.

5.5 Is CCI suitable for scalping?


CCI can be used in short-term strategies because shorter settings respond quickly to momentum changes. However, fast settings can produce frequent false signals. Scalpers should seek additional confirmation, define a stop-loss level, and only use an amount they can afford to lose.

5.6 Does a move above +100 always mean buy?


No. A move above +100 may indicate strengthening bullish momentum or the beginning of an uptrend, but it can also occur when the market is already extended and vulnerable to a pullback. Traders should consider the broader trend, price structure, volume, and other indicators before entering a position.


Risk Warning: Technical indicators are based on historical data and do not guarantee future performance. Digital assets are highly volatile. Trade cautiously based on your risk tolerance and avoid blindly following market trends.

How to Use the Commodity Channel Index (CCI) in Trading: A Complete Beginner's Guide

Key Takeaways

  • The Commodity Channel Index (CCI) is an unbounded momentum oscillator that measures how far an asset's current price has moved from its historical average.
  • Readings above +100 may indicate strong bullish momentum, while readings below -100 may indicate strong bearish momentum or oversold conditions.
  • Common CCI settings use 14 or 20 periods, but the appropriate setting depends on the market, timeframe, and trading style.
  • Traders commonly use CCI to analyze overbought and oversold conditions, zero-line crossovers, and bullish or bearish divergence.
  • CCI is based on historical price data and should not be used alone. Traders should seek confirmation from price action, trend tools, volume, or other momentum indicators and apply appropriate risk controls.

1. What Is the Commodity Channel Index?


The Commodity Channel Index (CCI) is a momentum oscillator first introduced by technical analyst Donald Lambert in 1980. It measures the difference between an asset's current price and its average price over a selected number of periods. In simple terms, CCI helps traders assess whether price has moved unusually far above or below its recent average.

A high CCI reading means the current price is well above its historical average and may reflect strong upward momentum or an overbought market. A low reading means price is well below its average and may reflect a downtrend or oversold conditions. These readings describe current momentum; they do not guarantee the next price movement.

Unlike the Relative Strength Index (RSI), CCI has no fixed upper or lower boundary. Approximately 70% to 80% of CCI readings typically remain between -100 and +100, while around 20% to 30% move outside this range. Traders often watch these outer zones for potential momentum or reversal signals.


2. What Are the Best CCI Settings?


There is no universally best CCI setting. The most common settings are 14 or 20 periods, but the choice affects how quickly the indicator responds to price changes.

Shorter settings, such as fewer than 14 periods: CCI reacts more quickly, produces more frequent signals, and spends less time within the -100 to +100 range. This may suit short-term or scalping strategies, but it can also generate more market noise and false signals.

Longer settings, such as more than 20 periods: CCI becomes smoother and may produce more stable signals. This can be useful for medium- or longer-term trend analysis, although the indicator will respond more slowly to new price movements.

In highly volatile cryptocurrency markets, some traders use wider reference levels, such as ±200, to identify more extreme readings. Beginners are advised to test different settings in a simulated environment before using them in live trading. The selected period and threshold should match the asset's volatility, the chart timeframe, and the trader's risk tolerance.


3. How to Use CCI in Trading


CCI can support several forms of market analysis, but each signal should be interpreted within the broader trend and confirmed with other evidence. The following three approaches are among the most common.

3.1 Overbought and oversold signals


When CCI crosses above +100, price is significantly above its recent average. This may indicate strengthening bullish momentum. When CCI crosses below -100, it may indicate strengthening bearish momentum or oversold conditions. Neither crossover should be treated as an automatic instruction to enter a trade.

In short-term trading, a move below -100 followed by a recovery above -100 may provide a potential bullish setup. Similarly, when CCI rises above +100 and later falls back below it, traders may consider whether upward momentum is weakening. Price structure, volume, or a trend indicator can provide additional confirmation before an entry or exit.

Because CCI is unbounded, it can remain at an elevated or depressed level during a strong trend. A market that appears overbought may continue rising, while an oversold market may continue falling. Traders should therefore avoid relying on the threshold alone and may use stop-loss orders or smaller position sizes to manage risk.

3.2 Zero-line crossovers


CCI oscillates around a zero line, which represents the relationship between current price and its moving average. A crossover above zero may indicate that momentum has turned positive, while a crossover below zero may indicate that momentum has turned negative.

Zero-line crossovers can help traders identify the early stages of a potential trend, especially when they align with a breakout or a change in market structure. In a sideways market, however, CCI may cross the zero line repeatedly and generate false signals. Waiting for a candle close or confirming the move with trend and volume indicators may reduce premature entries.

3.3 Bullish and bearish divergence


Divergence occurs when price and CCI move in different directions. If price reaches a new low while CCI forms a higher low, a bullish divergence may be developing. This can suggest that downward momentum is weakening and that an upward reversal may become possible.

If price reaches a new high while CCI forms a lower high, a bearish divergence may indicate weakening upward momentum and a possible downside reversal. Divergence can persist before price changes direction, so traders should wait for confirmation from price action, support or resistance, volume, or another momentum indicator. A divergence signal alone does not confirm that a reversal will occur.

4. CCI vs. RSI: What is the difference?


CCI and RSI are both momentum oscillators, but they measure different aspects of price behavior. RSI is bounded between 0 and 100 and commonly uses 70 and 30 as overbought and oversold reference levels. CCI has no fixed range and commonly uses +100 and -100 as its main reference levels.

CCI measures how far the current price has moved from its recent average price, making it useful for identifying extreme deviations and changes in trend momentum. RSI measures the speed and magnitude of recent price changes and may provide more stable readings in range-bound markets.

Feature
CCI
RSI
Range
Unbounded
0 to 100
Common Levels
+100 and -100
70 and 30
Primary Focus
Price deviation from its average
Speed and magnitude of price changes
Typical Use
Trend strength and extreme price deviation
Momentum analysis in trending or range-bound markets

Neither indicator is universally better. The appropriate choice depends on the market environment, timeframe, and trading strategy. Traders may also use CCI and RSI together to compare momentum signals, but agreement between two indicators still does not guarantee a successful trade.

5. Commodity Channel Index FAQ


5.1 What is the CCI indicator?


CCI is a momentum oscillator that compares an asset's current price with its historical average. Traders use it to analyze unusually strong or weak price movements, overbought or oversold conditions, and potential changes in trend momentum.

5.2 What are the best CCI settings?


There is no single best setting for every market. Common settings are 14 or 20 periods. Shorter settings respond faster but may generate more noise, while longer settings are smoother but more delayed. In highly volatile markets, some traders use ±200 reference levels, but any adjustment should be tested against the asset, timeframe, and trading style.

5.3 How can I use CCI on MEXC?


Navigation: MEXC website → Spot or Futures → Indicators → CCI

5.4 Is CCI better than RSI?


No indicator is universally better. CCI is unbounded and may respond more strongly to price deviations and trend acceleration. RSI has a fixed 0–100 range and may be easier to interpret in range-bound markets. The choice depends on the trader's timeframe, market conditions, and strategy.

5.5 Is CCI suitable for scalping?


CCI can be used in short-term strategies because shorter settings respond quickly to momentum changes. However, fast settings can produce frequent false signals. Scalpers should seek additional confirmation, define a stop-loss level, and only use an amount they can afford to lose.

5.6 Does a move above +100 always mean buy?


No. A move above +100 may indicate strengthening bullish momentum or the beginning of an uptrend, but it can also occur when the market is already extended and vulnerable to a pullback. Traders should consider the broader trend, price structure, volume, and other indicators before entering a position.


Risk Warning: Technical indicators are based on historical data and do not guarantee future performance. Digital assets are highly volatile. Trade cautiously based on your risk tolerance and avoid blindly following market trends.