क्रिप्टो खरीदें
मार्केट
स्पॉट
फ़्यूचर्सBTC
कमाएँ
इवेंट सेंटर
रिवॉर्ड हब
अधिक
How to Use the CR Energy Index in Trading: A Complete Beginner's GuideHow to Use the CR Energy Index in Trading: A Complete Beginner's Guide
कैटेगरी की लिस्ट
कैंसिल करें

How to Use the CR Energy Index in Trading: A Complete Beginner's Guide

Key Takeaways

  • The CR Energy Index is a momentum indicator that compares upward and downward price pressure relative to the previous period's midpoint.
  • CR is commonly centered around 100. Readings above or below this level may help traders assess the balance between buying and selling pressure, but they do not predict direction with certainty.
  • Levels such as 40 and 300–400 are traditional reference zones rather than automatic buy or sell signals. Market structure, volume, and other indicators should be used for confirmation.
  • CR can be viewed together with several moving-average lines to identify possible support, resistance, momentum shifts, and divergence.
  • On MEXC, users can add CR from the chart's Indicators menu and adjust its parameters to match their timeframe and trading approach.

1. What Is the CR Energy Index?


The CR Energy Index, also called the CR indicator or Energy Index, is a technical analysis tool used to compare buying and selling pressure over a selected period. It measures how far each period's high and low move relative to the previous period's midpoint.

In simple terms, CR attempts to show whether bullish or bearish pressure is becoming stronger. It can also be viewed with moving-average lines to identify potential support and resistance zones. Because CR is based on historical price data, it should be treated as an analytical reference rather than a prediction of future performance.

For beginners, the most useful way to read CR is to combine three elements: the indicator's position relative to 100, the speed and direction of its movement, and its relationship with the accompanying moving-average lines. You can access the CR indicator directly from the charting tools on MEXC.

2. How Is the CR Energy Index Calculated?


CR first calculates a midpoint for the previous period, then compares the current period's high and low with that midpoint. The standard calculation commonly uses 26 periods.

Step 1: Calculate the midpoint

Midpoint = (High + Low) / 2

Step 2: Calculate upward and downward movement

Upward movement = max(0, Current High − Previous Midpoint)

Downward movement = max(0, Previous Midpoint − Current Low)

Step 3: Add the values over the selected period

For the standard 26-period setting, add all upward movement values to obtain total bullish pressure, and add all downward movement values to obtain total bearish pressure.

Step 4: Calculate CR

CR = (Sum of Upward Movement / Sum of Downward Movement) × 100

A CR value of 100 means that the measured upward and downward pressure is equal over the calculation window. A higher or lower reading shows the relative balance of the two, not a guaranteed future price move.

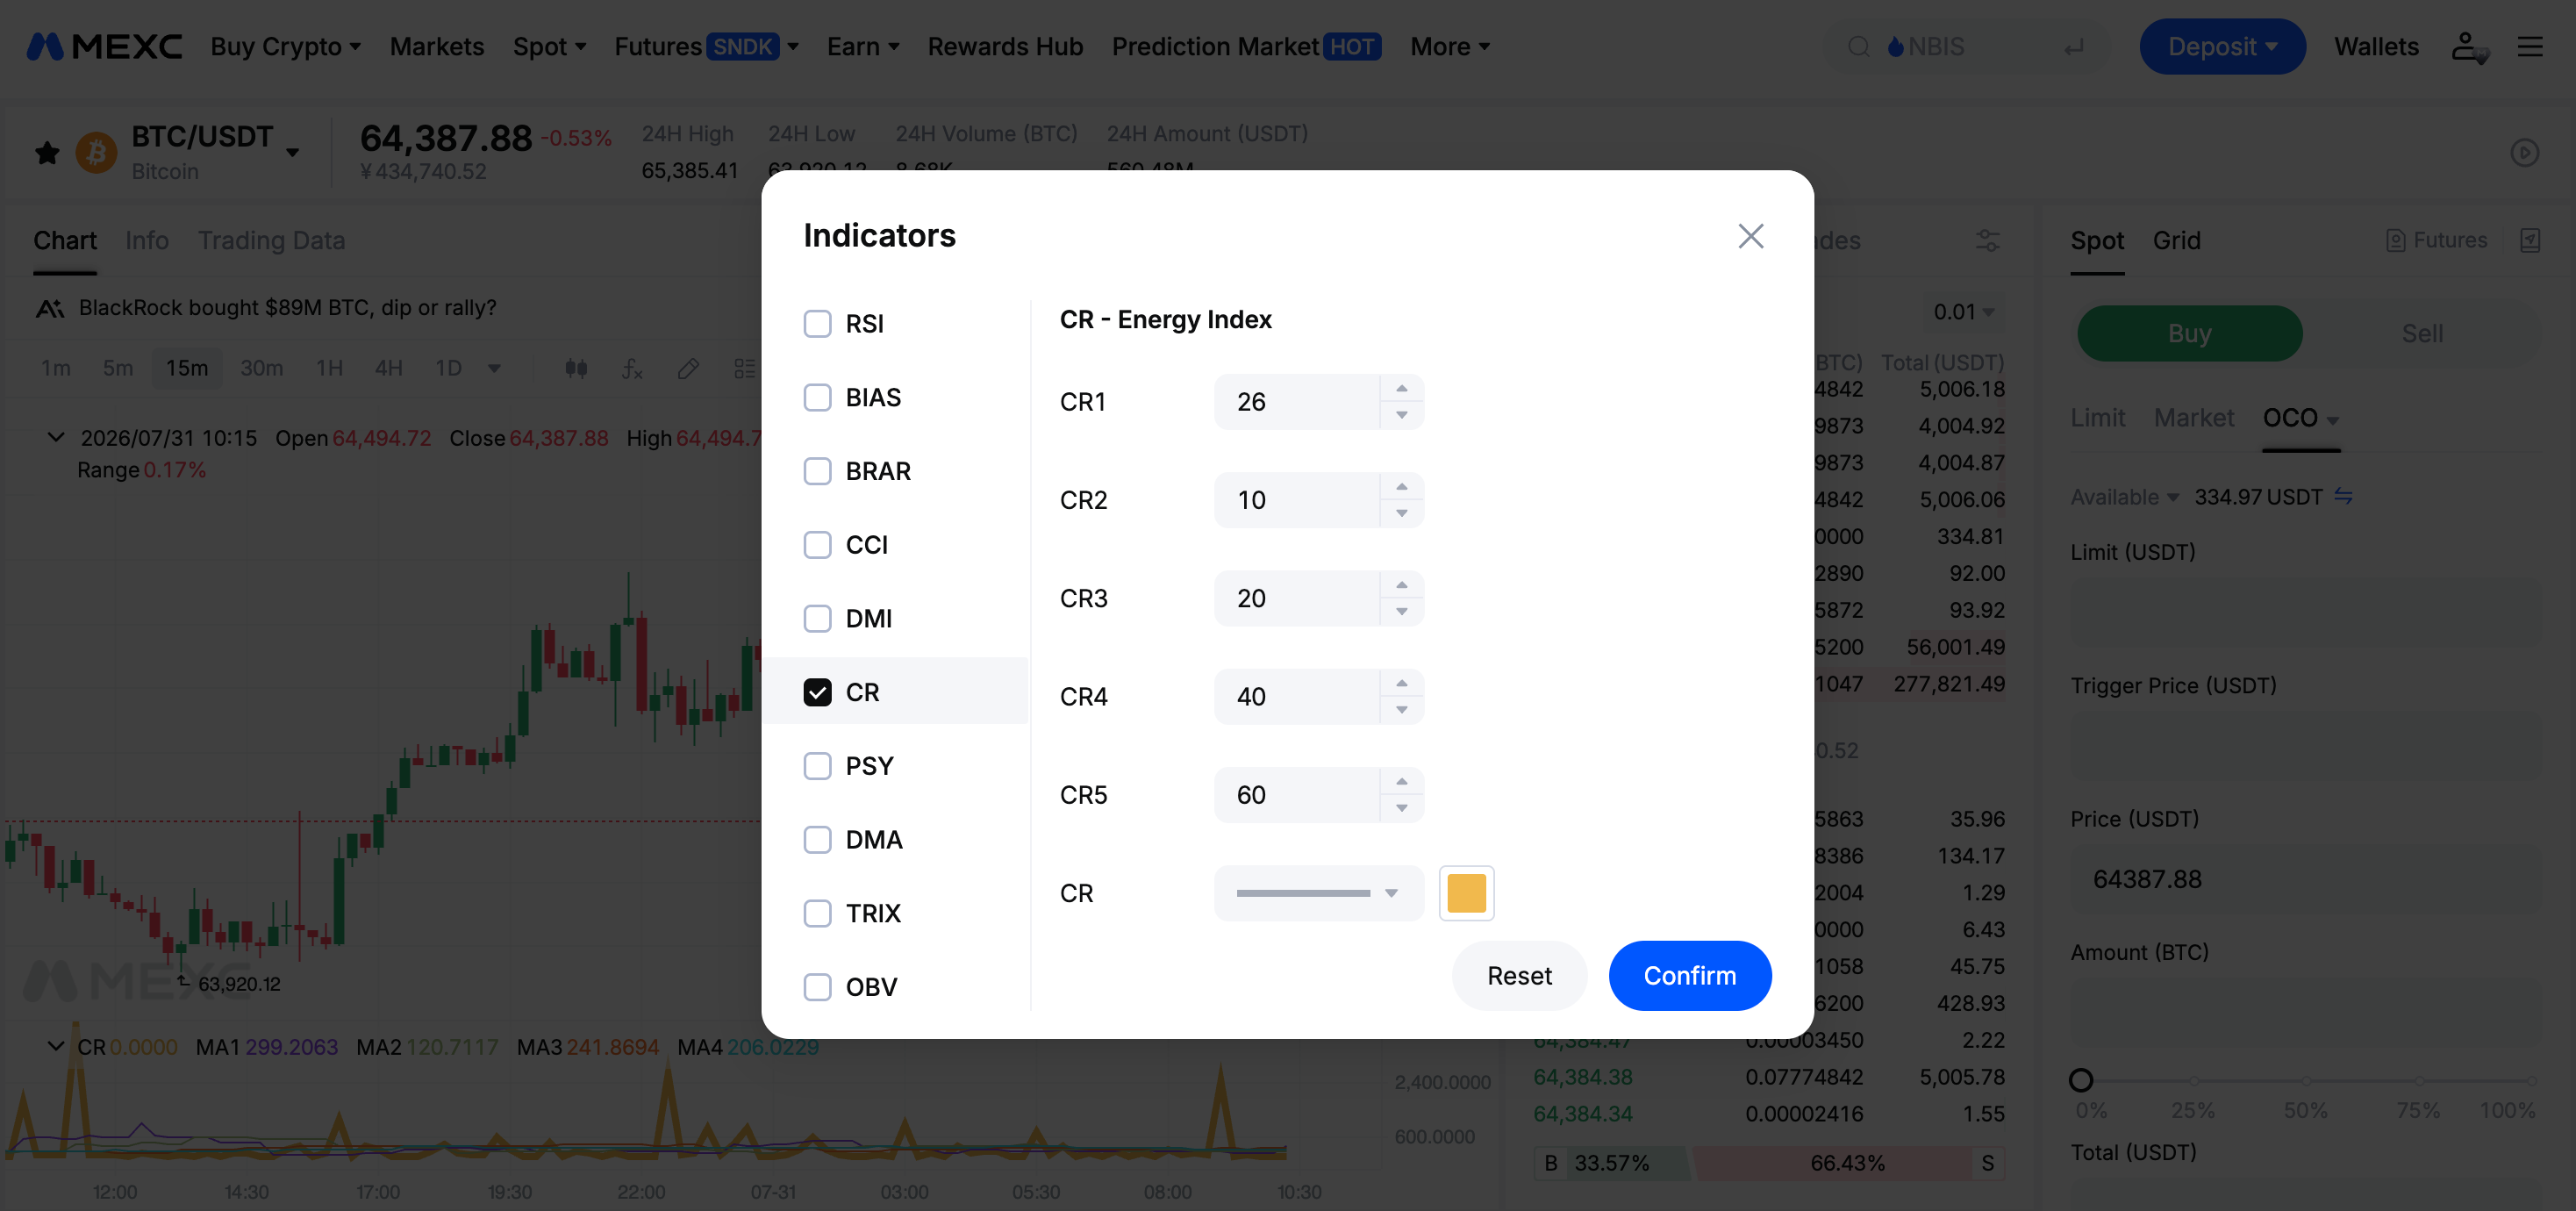
MEXC's CR settings shown below use 26 for the main CR period and 10, 20, 40, and 60 for the auxiliary lines. Parameters may vary across charting platforms, so refer to the values displayed on the relevant page rather than assuming that one configuration is universal.

3. How to Use the CR Energy Index in Trading


3.1 Use the 100 centerline to assess market strength


The 100 level serves as CR's centerline. When CR remains above 100 for an extended period, upward pressure may be stronger than downward pressure. When it remains below 100, bearish pressure may be more dominant.

A move through 100 may indicate a shift in momentum, but a single crossover is not enough to confirm a reversal. Traders may wait for the move to persist, review the broader trend, and use volume or price structure for additional confirmation.


3.2 Treat extreme readings as alert zones


Traditional CR analysis often treats readings below 40 as a possible oversold zone and readings around 300–400 or higher as a possible overheated zone. These thresholds can help traders identify conditions that deserve closer attention.

However, CR below 40 does not mean that a bottom has formed, and CR above 300–400 does not mean that a decline must follow. Strong trends can keep the indicator at extreme levels for longer than expected. Traders should look for confirmation from price action, volume, volatility, or another momentum indicator before entering or reducing a position.

3.3 Compare CR with its moving-average zones


CR is commonly displayed with multiple moving-average lines. Some CR methods group the shorter lines into a secondary zone and the longer lines into a primary zone. When CR rises into or crosses these zones, they may act as areas of resistance. When CR falls into or crosses them from above, they may act as areas of support.

These zones are not fixed price levels. If CR moves inside a cluster of averages, momentum may become less clear and price may consolidate. In that situation, traders can wait for a confirmed break, check whether the moving averages are expanding or converging, and reduce position size if volatility is elevated.

3.4 Watch for rapid rebounds below the moving averages


One traditional CR setup looks for the indicator to fall below all auxiliary lines and then rebound to roughly 160% of its recent low. For example, a rise from 100 to 160 would meet this numerical condition. Some traders interpret this as a potential short-term profit-taking signal after a rebound.

Context matters. During a strong uptrend, a drop below the auxiliary lines may instead be part of a temporary pullback. Traders should review the prevailing trend, nearby support, volume, and the behavior of the price itself before acting.

3.5 Monitor rare moving-average convergence


When several CR moving-average lines converge near the same point, the indicator may be approaching a transition in momentum. This pattern is relatively uncommon and may draw attention to a potential turning window.

Convergence alone does not show whether price will move up or down. Traders may wait for CR to break away from the cluster, then use market structure and volume to assess direction. A stop-loss may be placed at a level that invalidates the setup, subject to the trader's risk tolerance and timeframe.

4. Confirmation Tools and Risk Management


The CR indicator has two key limitations:
1. Once the CR enters the "earthquake zone," it is difficult to determine whether it will move through the zone smoothly.
2. During extremely strong market trends, the CR may continue rising indefinitely, making it difficult to judge whether it has already reached a high level.

The CR indicator is generally more effective at identifying potential market bottoms than tops. Using it to identify tops carries greater risk and should be confirmed with other indicators, such as the volume ratio and Bollinger Bands. Once the CR rises above 250 and continues climbing, its usual high-level signal rules may need to be adjusted accordingly. Divergence may also occur between the CR and price, especially when prices are at elevated levels, so additional caution is warranted.

When trading crypto assets on MEXC, consider using the CR indicator together with tools such as the Williams %R and Moving Averages, rather than relying on a single signal. The crypto market can be highly volatile, so proper position sizing and risk management are essential.

5. CR Energy Index FAQ


5.1 What is the CR Energy Index?


The CR Energy Index is a momentum indicator that compares upward and downward price pressure relative to the previous period's midpoint. It is designed to help traders assess market strength, potential extreme conditions, and changes in momentum.

5.2 How is CR calculated?


CR adds upward and downward movement over a selected period, commonly 26 periods, then divides total upward movement by total downward movement and multiplies the result by 100. Each movement value is measured relative to the previous period's midpoint.

5.3 What unit does CR use?


CR has no currency unit. It is a ratio-based value centered around 100, representing the relative balance between measured upward and downward pressure.

5.4 What CR levels should beginners watch?


Traders often monitor 100 as the centerline, below 40 as a possible oversold zone, and 300–400 or higher as a possible overheated zone. These are reference levels, not universal trading rules. Their usefulness depends on the asset, timeframe, volatility, and market regime.

5.5 Can CR predict market reversals?


No. CR may highlight changes in momentum, divergence, or moving-average convergence, but it cannot reliably predict the timing or direction of a reversal. Confirmation from price action and other indicators is still required.

5.6 How can beginners use the CR on MEXC?


Navigation: MEXC Website → Spot/Futures → Indicators → CR


Risk Warning: Technical indicators are based on historical data and do not guarantee future performance. Digital assets are highly volatile. Trade cautiously based on your risk tolerance and avoid blindly following market trends.

How to Use the CR Energy Index in Trading: A Complete Beginner's Guide

Key Takeaways

  • The CR Energy Index is a momentum indicator that compares upward and downward price pressure relative to the previous period's midpoint.
  • CR is commonly centered around 100. Readings above or below this level may help traders assess the balance between buying and selling pressure, but they do not predict direction with certainty.
  • Levels such as 40 and 300–400 are traditional reference zones rather than automatic buy or sell signals. Market structure, volume, and other indicators should be used for confirmation.
  • CR can be viewed together with several moving-average lines to identify possible support, resistance, momentum shifts, and divergence.
  • On MEXC, users can add CR from the chart's Indicators menu and adjust its parameters to match their timeframe and trading approach.

1. What Is the CR Energy Index?


The CR Energy Index, also called the CR indicator or Energy Index, is a technical analysis tool used to compare buying and selling pressure over a selected period. It measures how far each period's high and low move relative to the previous period's midpoint.

In simple terms, CR attempts to show whether bullish or bearish pressure is becoming stronger. It can also be viewed with moving-average lines to identify potential support and resistance zones. Because CR is based on historical price data, it should be treated as an analytical reference rather than a prediction of future performance.

For beginners, the most useful way to read CR is to combine three elements: the indicator's position relative to 100, the speed and direction of its movement, and its relationship with the accompanying moving-average lines. You can access the CR indicator directly from the charting tools on MEXC.

2. How Is the CR Energy Index Calculated?


CR first calculates a midpoint for the previous period, then compares the current period's high and low with that midpoint. The standard calculation commonly uses 26 periods.

Step 1: Calculate the midpoint

Midpoint = (High + Low) / 2

Step 2: Calculate upward and downward movement

Upward movement = max(0, Current High − Previous Midpoint)

Downward movement = max(0, Previous Midpoint − Current Low)

Step 3: Add the values over the selected period

For the standard 26-period setting, add all upward movement values to obtain total bullish pressure, and add all downward movement values to obtain total bearish pressure.

Step 4: Calculate CR

CR = (Sum of Upward Movement / Sum of Downward Movement) × 100

A CR value of 100 means that the measured upward and downward pressure is equal over the calculation window. A higher or lower reading shows the relative balance of the two, not a guaranteed future price move.

MEXC's CR settings shown below use 26 for the main CR period and 10, 20, 40, and 60 for the auxiliary lines. Parameters may vary across charting platforms, so refer to the values displayed on the relevant page rather than assuming that one configuration is universal.


3. How to Use the CR Energy Index in Trading


3.1 Use the 100 centerline to assess market strength


The 100 level serves as CR's centerline. When CR remains above 100 for an extended period, upward pressure may be stronger than downward pressure. When it remains below 100, bearish pressure may be more dominant.

A move through 100 may indicate a shift in momentum, but a single crossover is not enough to confirm a reversal. Traders may wait for the move to persist, review the broader trend, and use volume or price structure for additional confirmation.


3.2 Treat extreme readings as alert zones


Traditional CR analysis often treats readings below 40 as a possible oversold zone and readings around 300–400 or higher as a possible overheated zone. These thresholds can help traders identify conditions that deserve closer attention.

However, CR below 40 does not mean that a bottom has formed, and CR above 300–400 does not mean that a decline must follow. Strong trends can keep the indicator at extreme levels for longer than expected. Traders should look for confirmation from price action, volume, volatility, or another momentum indicator before entering or reducing a position.

3.3 Compare CR with its moving-average zones


CR is commonly displayed with multiple moving-average lines. Some CR methods group the shorter lines into a secondary zone and the longer lines into a primary zone. When CR rises into or crosses these zones, they may act as areas of resistance. When CR falls into or crosses them from above, they may act as areas of support.

These zones are not fixed price levels. If CR moves inside a cluster of averages, momentum may become less clear and price may consolidate. In that situation, traders can wait for a confirmed break, check whether the moving averages are expanding or converging, and reduce position size if volatility is elevated.

3.4 Watch for rapid rebounds below the moving averages


One traditional CR setup looks for the indicator to fall below all auxiliary lines and then rebound to roughly 160% of its recent low. For example, a rise from 100 to 160 would meet this numerical condition. Some traders interpret this as a potential short-term profit-taking signal after a rebound.

Context matters. During a strong uptrend, a drop below the auxiliary lines may instead be part of a temporary pullback. Traders should review the prevailing trend, nearby support, volume, and the behavior of the price itself before acting.

3.5 Monitor rare moving-average convergence


When several CR moving-average lines converge near the same point, the indicator may be approaching a transition in momentum. This pattern is relatively uncommon and may draw attention to a potential turning window.

Convergence alone does not show whether price will move up or down. Traders may wait for CR to break away from the cluster, then use market structure and volume to assess direction. A stop-loss may be placed at a level that invalidates the setup, subject to the trader's risk tolerance and timeframe.

4. Confirmation Tools and Risk Management


The CR indicator has two key limitations:
1. Once the CR enters the "earthquake zone," it is difficult to determine whether it will move through the zone smoothly.
2. During extremely strong market trends, the CR may continue rising indefinitely, making it difficult to judge whether it has already reached a high level.

The CR indicator is generally more effective at identifying potential market bottoms than tops. Using it to identify tops carries greater risk and should be confirmed with other indicators, such as the volume ratio and Bollinger Bands. Once the CR rises above 250 and continues climbing, its usual high-level signal rules may need to be adjusted accordingly. Divergence may also occur between the CR and price, especially when prices are at elevated levels, so additional caution is warranted.

When trading crypto assets on MEXC, consider using the CR indicator together with tools such as the Williams %R and Moving Averages, rather than relying on a single signal. The crypto market can be highly volatile, so proper position sizing and risk management are essential.

5. CR Energy Index FAQ


5.1 What is the CR Energy Index?


The CR Energy Index is a momentum indicator that compares upward and downward price pressure relative to the previous period's midpoint. It is designed to help traders assess market strength, potential extreme conditions, and changes in momentum.

5.2 How is CR calculated?


CR adds upward and downward movement over a selected period, commonly 26 periods, then divides total upward movement by total downward movement and multiplies the result by 100. Each movement value is measured relative to the previous period's midpoint.

5.3 What unit does CR use?


CR has no currency unit. It is a ratio-based value centered around 100, representing the relative balance between measured upward and downward pressure.

5.4 What CR levels should beginners watch?


Traders often monitor 100 as the centerline, below 40 as a possible oversold zone, and 300–400 or higher as a possible overheated zone. These are reference levels, not universal trading rules. Their usefulness depends on the asset, timeframe, volatility, and market regime.

5.5 Can CR predict market reversals?


No. CR may highlight changes in momentum, divergence, or moving-average convergence, but it cannot reliably predict the timing or direction of a reversal. Confirmation from price action and other indicators is still required.

5.6 How can beginners use the CR on MEXC?


Navigation: MEXC Website → Spot/Futures → Indicators → CR


Risk Warning: Technical indicators are based on historical data and do not guarantee future performance. Digital assets are highly volatile. Trade cautiously based on your risk tolerance and avoid blindly following market trends.