क्रिप्टो खरीदें
मार्केट
स्पॉट
फ़्यूचर्सBTC
कमाएँ
इवेंट सेंटर
रिवॉर्ड हब
अधिक
How to Use the Directional Movement Index (DMI) in Trading: A Complete Beginner's GuideHow to Use the Directional Movement Index (DMI) in Trading: A Complete Beginner's Guide
कैटेगरी की लिस्ट
कैंसिल करें

How to Use the Directional Movement Index (DMI) in Trading: A Complete Beginner's Guide

Key Takeaways

  • The Directional Movement Index (DMI) is a technical analysis tool used to identify market trend direction and measure trend strength.
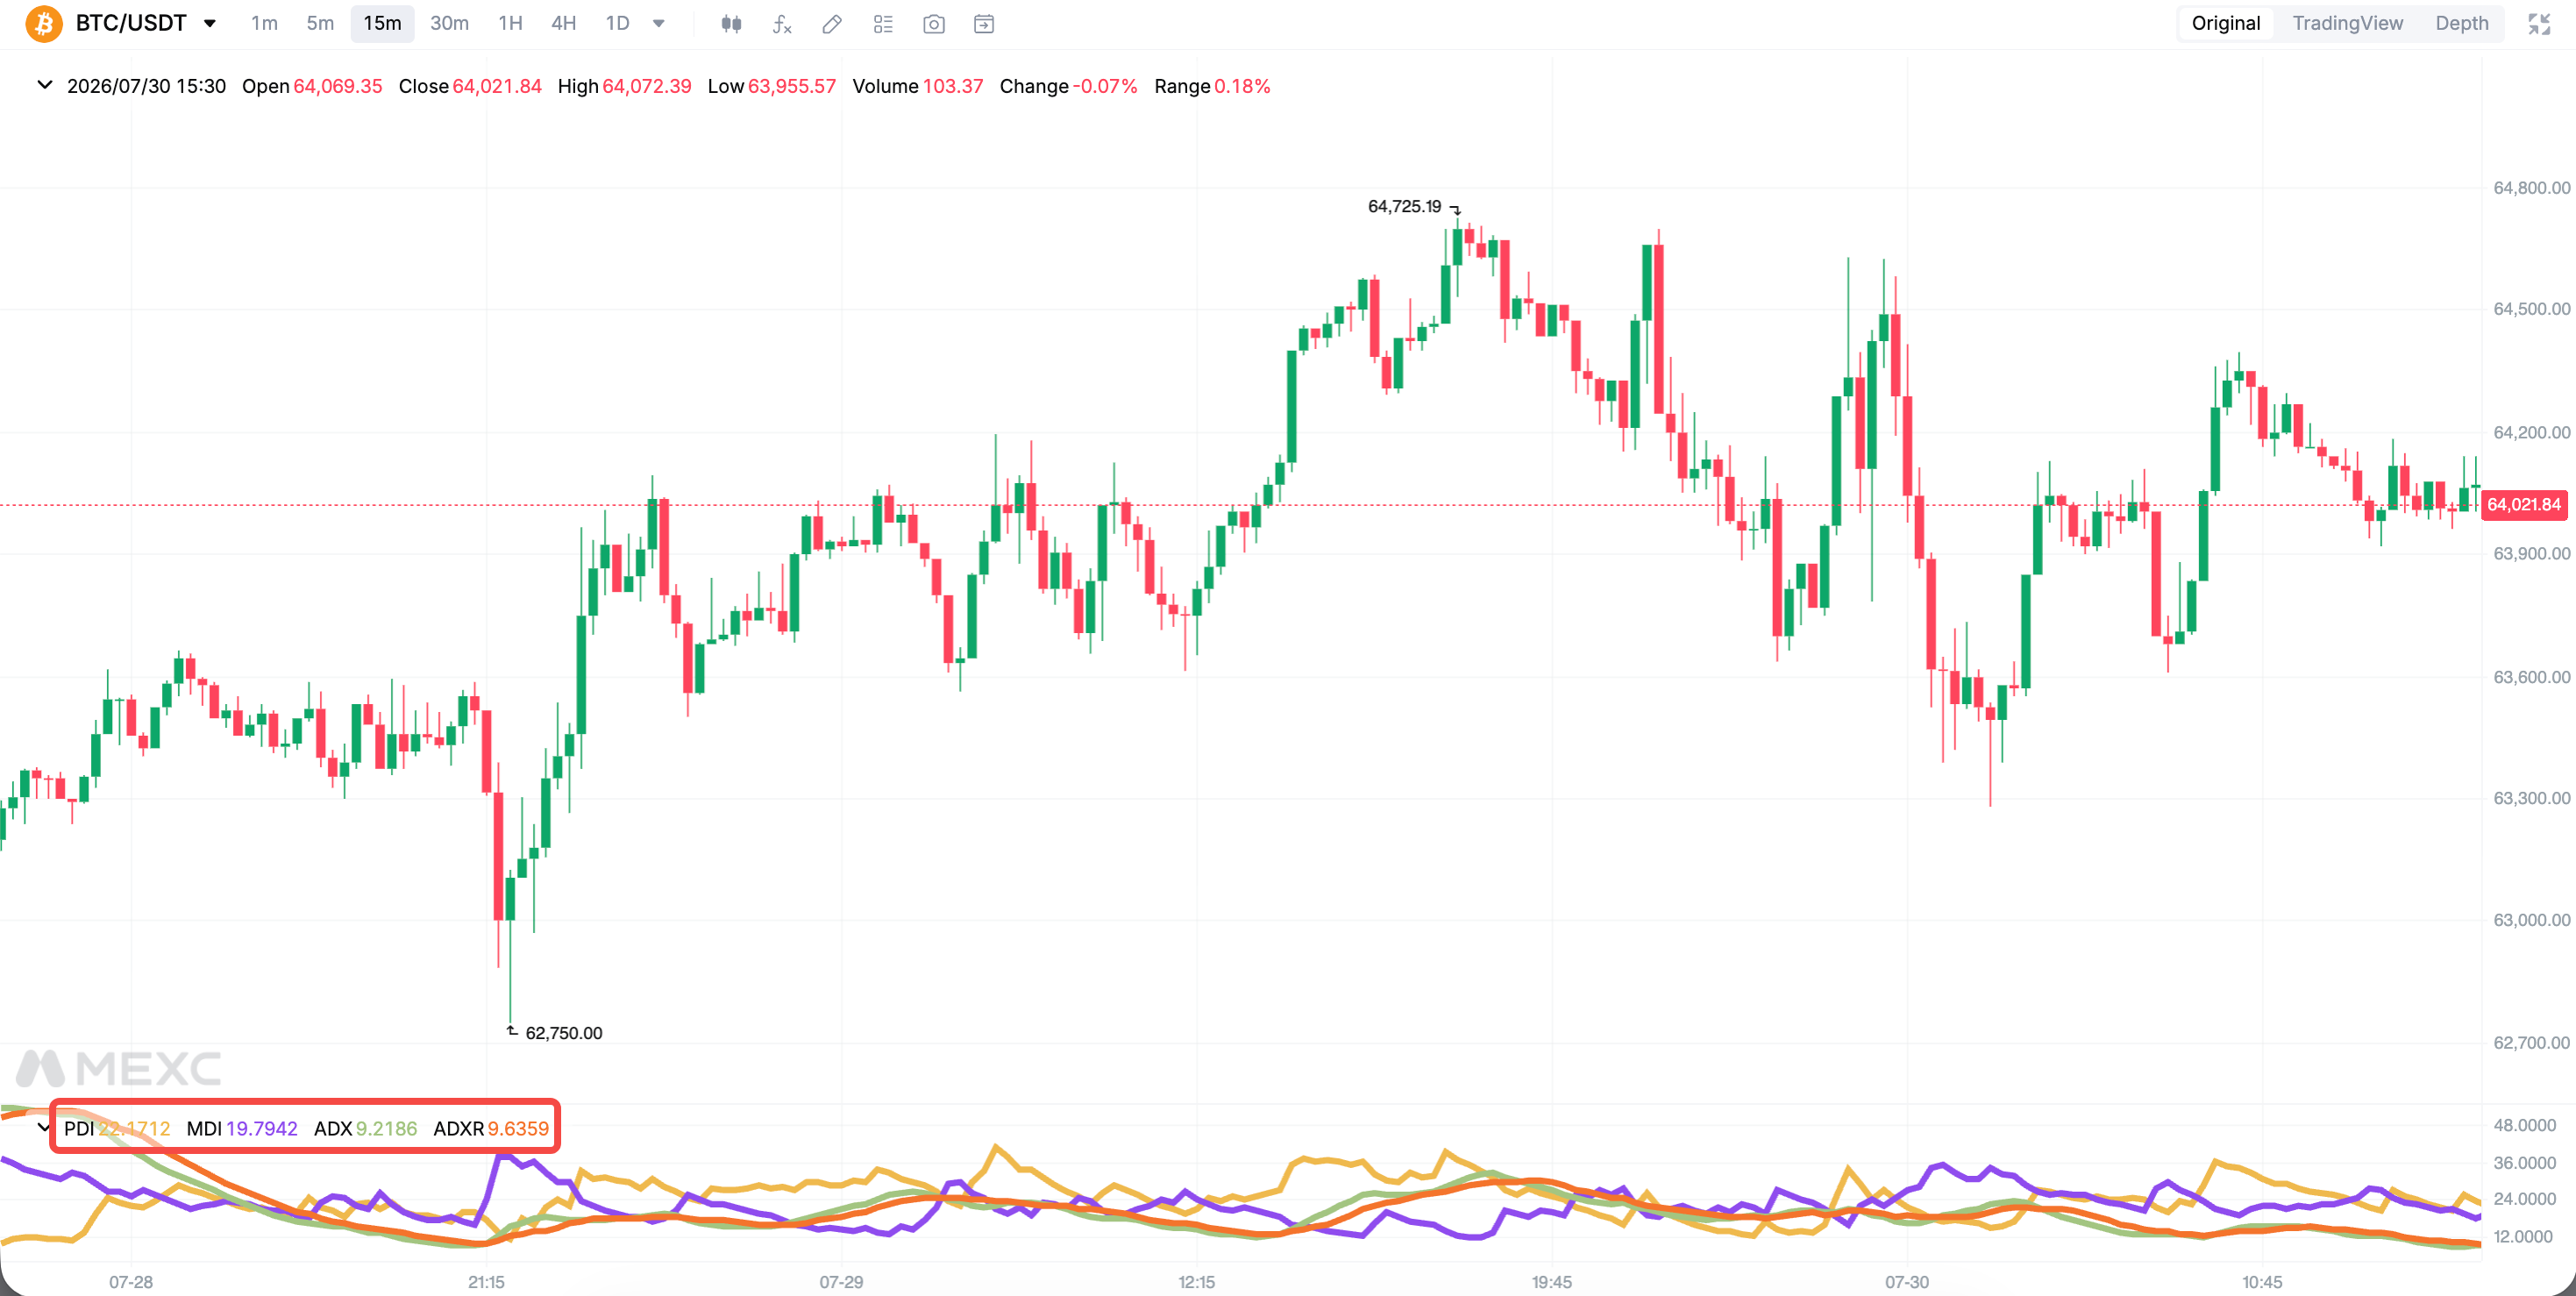
  • DMI consists of four lines: the Positive Directional Indicator (PDI), Negative Directional Indicator (MDI), Average Directional Index (ADX), and Average Directional Movement Index Rating (ADXR).
  • When PDI crosses above MDI and ADX is above 25, it is generally considered a bullish signal. Conversely, when MDI crosses above PDI and ADX is above 25, it may indicate a bearish signal.
  • ADXR is a smoothed version of ADX that helps confirm whether trend strength is sustainable and reduces the impact of short-term fluctuations and false signals.
  • Users can add DMI directly to charts on MEXC and use it alongside other technical indicators to support trading decisions.

1. What Is the Directional Movement Index?


The Directional Movement Index (DMI) is a technical analysis indicator developed by J. Welles Wilder in 1978. What distinguishes DMI from many other indicators is its ability to evaluate both the direction and strength of price movements. This helps traders distinguish established trends from range-bound or directionless markets.

Crypto markets can experience significant price volatility. When trading on MEXC, DMI can help users assess whether buyers or sellers currently dominate the market and whether the prevailing directional movement is strong enough to warrant further attention. This may help reduce unnecessary trades caused by frequent price fluctuations in sideways markets.

2. The Four Components of DMI


Positive Directional Indicator (PDI): Measures the strength of upward price movement over a given period. PDI generally rises as buying pressure strengthens.

Negative Directional Indicator (MDI): Measures the strength of downward price movement. MDI generally rises as selling pressure increases.

Average Directional Index (ADX): Measures trend strength rather than trend direction. Whether prices are rising or falling, ADX generally increases when the prevailing trend becomes stronger.

Average Directional Movement Index Rating (ADXR): A smoother version of ADX used to evaluate the persistence and stability of trend strength. It serves as an additional confirmation tool within the DMI system.

3. How to Interpret DMI Signals


Identifying Trend Direction: When PDI is above MDI, buying momentum is stronger than selling momentum, indicating a bullish market bias. When MDI is above PDI, selling momentum is stronger, indicating a bearish market bias.

Measuring Trend Strength With ADX:
  • Below 20: The trend is weak or the market is moving sideways, making trend-following strategies less suitable.
  • Between 20 and 40: A trend is developing and gradually strengthening.
  • Above 40: The trend is relatively strong, and traders may consider maintaining positions in the direction of the prevailing trend.
  • ADX measures only trend strength, not direction. A rising ADX can therefore occur during either a strong uptrend or a strong downtrend.

4. DMI Trading Strategies


Crossover Strategy: A PDI and MDI crossover is one of the most basic and commonly used DMI signals. When PDI crosses above MDI, it generates a potential buy signal. When MDI crosses above PDI, it generates a potential sell signal.

ADX Filter Strategy: In sideways markets, crossover signals may produce frequent false signals. Traders may wait for ADX to rise above 25 and continue higher before acting on a crossover. If ADX is below 20, it may be better to wait for a clearer trend.

Combined Confirmation Strategy: DMI can be combined with moving averages and RSI for additional confirmation. For example, a PDI crossover above MDI may provide a stronger bullish signal when ADX is rising, price is above the moving average, and RSI is above 50 without being overbought.


5. Limitations of DMI


As a trend-following indicator, DMI is calculated using historical price data and therefore has a certain degree of lag.

In sideways markets, PDI and MDI may repeatedly cross each other, producing false signals. For this reason, DMI should generally be used together with other technical analysis tools and appropriate risk management measures, including stop-loss orders.

6. DMI FAQ


6.1 How to read DMI?


Compare PDI and MDI to determine market direction. PDI above MDI indicates a bullish bias, while MDI above PDI indicates a bearish bias.

Then use ADX to confirm trend strength. An ADX reading above 25 is commonly considered an indication that a meaningful trend is present.

6.2 What is the best DMI setting?


The default 14-period setting is the industry standard and is suitable for most trading scenarios.

Short-term traders may shorten the period to make DMI more responsive to price changes. Swing traders can retain the default setting or use a longer period to obtain smoother signals.


6.3 Is ADX suitable for day trading?


Yes. However, shorter timeframes tend to generate more market noise, which can reduce signal accuracy. For day trading, ADX is best used as a filter, with crossover signals considered when ADX is above 25 and confirmed by price structure.

6.4 What is the difference between DMI and ADX?


ADX is a component of the DMI system rather than the complete indicator itself.

The full DMI system consists of PDI, MDI, ADX, and ADXR. PDI and MDI are primarily used to assess direction, while ADX and ADXR are used to evaluate trend strength and its persistence.

6.5 How to use DMI on MEXC


Go to MEXC official website→ Spot/Futures → Indicators → DMI


Risk Disclaimer:Technical indicators are calculated based on historical market data and are provided for reference only. They cannot guarantee future market movements. Digital asset markets are highly volatile and involve significant risk. Please make trading decisions carefully based on your own risk tolerance and avoid blindly following market signals.

How to Use the Directional Movement Index (DMI) in Trading: A Complete Beginner's Guide

Key Takeaways

  • The Directional Movement Index (DMI) is a technical analysis tool used to identify market trend direction and measure trend strength.
  • DMI consists of four lines: the Positive Directional Indicator (PDI), Negative Directional Indicator (MDI), Average Directional Index (ADX), and Average Directional Movement Index Rating (ADXR).
  • When PDI crosses above MDI and ADX is above 25, it is generally considered a bullish signal. Conversely, when MDI crosses above PDI and ADX is above 25, it may indicate a bearish signal.
  • ADXR is a smoothed version of ADX that helps confirm whether trend strength is sustainable and reduces the impact of short-term fluctuations and false signals.
  • Users can add DMI directly to charts on MEXC and use it alongside other technical indicators to support trading decisions.

1. What Is the Directional Movement Index?


The Directional Movement Index (DMI) is a technical analysis indicator developed by J. Welles Wilder in 1978. What distinguishes DMI from many other indicators is its ability to evaluate both the direction and strength of price movements. This helps traders distinguish established trends from range-bound or directionless markets.

Crypto markets can experience significant price volatility. When trading on MEXC, DMI can help users assess whether buyers or sellers currently dominate the market and whether the prevailing directional movement is strong enough to warrant further attention. This may help reduce unnecessary trades caused by frequent price fluctuations in sideways markets.

2. The Four Components of DMI


Positive Directional Indicator (PDI): Measures the strength of upward price movement over a given period. PDI generally rises as buying pressure strengthens.

Negative Directional Indicator (MDI): Measures the strength of downward price movement. MDI generally rises as selling pressure increases.

Average Directional Index (ADX): Measures trend strength rather than trend direction. Whether prices are rising or falling, ADX generally increases when the prevailing trend becomes stronger.

Average Directional Movement Index Rating (ADXR): A smoother version of ADX used to evaluate the persistence and stability of trend strength. It serves as an additional confirmation tool within the DMI system.


3. How to Interpret DMI Signals


Identifying Trend Direction: When PDI is above MDI, buying momentum is stronger than selling momentum, indicating a bullish market bias. When MDI is above PDI, selling momentum is stronger, indicating a bearish market bias.

Measuring Trend Strength With ADX:
  • Below 20: The trend is weak or the market is moving sideways, making trend-following strategies less suitable.
  • Between 20 and 40: A trend is developing and gradually strengthening.
  • Above 40: The trend is relatively strong, and traders may consider maintaining positions in the direction of the prevailing trend.
  • ADX measures only trend strength, not direction. A rising ADX can therefore occur during either a strong uptrend or a strong downtrend.

4. DMI Trading Strategies


Crossover Strategy: A PDI and MDI crossover is one of the most basic and commonly used DMI signals. When PDI crosses above MDI, it generates a potential buy signal. When MDI crosses above PDI, it generates a potential sell signal.

ADX Filter Strategy: In sideways markets, crossover signals may produce frequent false signals. Traders may wait for ADX to rise above 25 and continue higher before acting on a crossover. If ADX is below 20, it may be better to wait for a clearer trend.

Combined Confirmation Strategy: DMI can be combined with moving averages and RSI for additional confirmation. For example, a PDI crossover above MDI may provide a stronger bullish signal when ADX is rising, price is above the moving average, and RSI is above 50 without being overbought.


5. Limitations of DMI


As a trend-following indicator, DMI is calculated using historical price data and therefore has a certain degree of lag.

In sideways markets, PDI and MDI may repeatedly cross each other, producing false signals. For this reason, DMI should generally be used together with other technical analysis tools and appropriate risk management measures, including stop-loss orders.

6. DMI FAQ


6.1 How to read DMI?


Compare PDI and MDI to determine market direction. PDI above MDI indicates a bullish bias, while MDI above PDI indicates a bearish bias.

Then use ADX to confirm trend strength. An ADX reading above 25 is commonly considered an indication that a meaningful trend is present.

6.2 What is the best DMI setting?


The default 14-period setting is the industry standard and is suitable for most trading scenarios.

Short-term traders may shorten the period to make DMI more responsive to price changes. Swing traders can retain the default setting or use a longer period to obtain smoother signals.


6.3 Is ADX suitable for day trading?


Yes. However, shorter timeframes tend to generate more market noise, which can reduce signal accuracy. For day trading, ADX is best used as a filter, with crossover signals considered when ADX is above 25 and confirmed by price structure.

6.4 What is the difference between DMI and ADX?


ADX is a component of the DMI system rather than the complete indicator itself.

The full DMI system consists of PDI, MDI, ADX, and ADXR. PDI and MDI are primarily used to assess direction, while ADX and ADXR are used to evaluate trend strength and its persistence.

6.5 How to use DMI on MEXC


Go to MEXC official website→ Spot/Futures → Indicators → DMI


Risk Disclaimer:Technical indicators are calculated based on historical market data and are provided for reference only. They cannot guarantee future market movements. Digital asset markets are highly volatile and involve significant risk. Please make trading decisions carefully based on your own risk tolerance and avoid blindly following market signals.