क्रिप्टो खरीदें
मार्केट
स्पॉट
फ़्यूचर्सBTC
कमाएँ
इवेंट सेंटर
रिवॉर्ड हब
अधिक
How to Use the Moving Average of Volume in Trading: A Complete Beginner's GuideHow to Use the Moving Average of Volume in Trading: A Complete Beginner's Guide
कैटेगरी की लिस्ट
कैंसिल करें

How to Use the Moving Average of Volume in Trading: A Complete Beginner's Guide

Key Takeaways

  • The volume indicator shows the total amount traded over a specific period and helps confirm the strength of price movements.
  • The Moving Average of Volume (MAVOL) smooths short-term fluctuations in trading volume. Common settings include 5, 10 and 20 periods.
  • You can add MAVOL through the indicator settings on MEXC and adjust the periods to suit your trading style.
  • MAVOL is a lagging indicator. Use it alongside other technical tools and always apply proper risk management and stop-loss measures.

1. What Is the Volume Indicator?


Volume is one of the most fundamental and important indicators in technical analysis. It represents the total amount of an asset traded within a specific period and is usually displayed as vertical bars below the price chart. A taller bar indicates higher trading activity, while a shorter bar suggests lower market participation.

2. What Is the Moving Average of Volume?


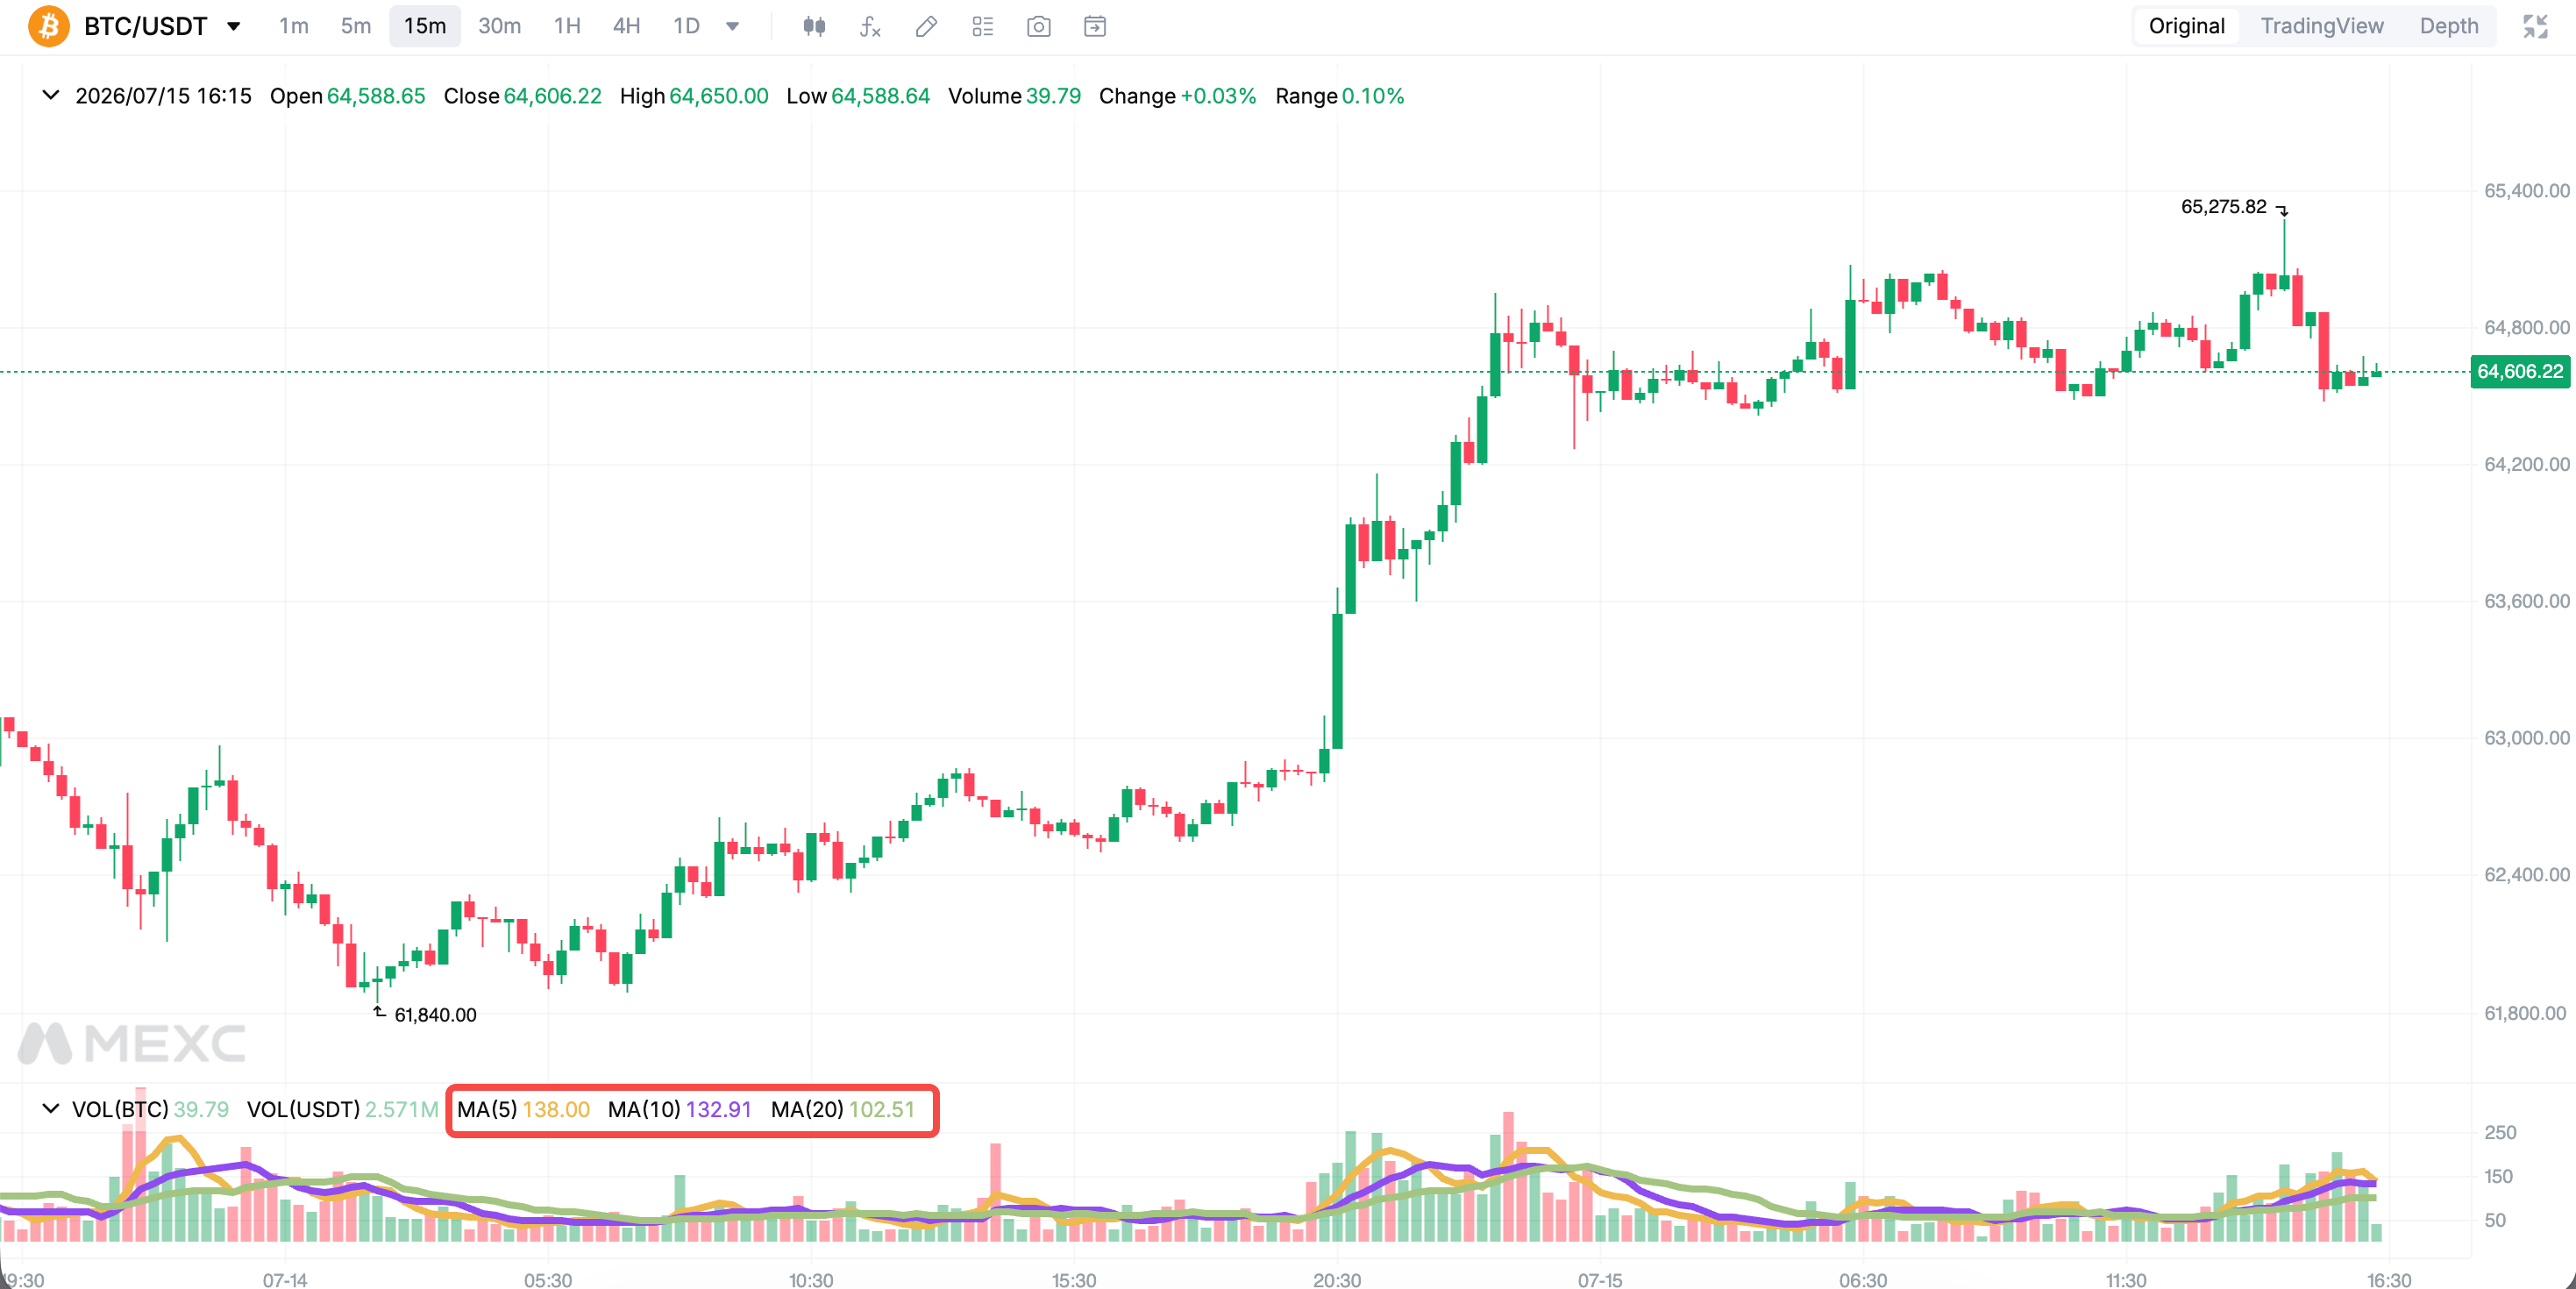
The Moving Average of Volume (MAVOL) is calculated by averaging trading volume over a specified number of periods.

Volume can fluctuate significantly from one period to another, making it difficult to identify the broader trend from volume bars alone. MAVOL smooths these short-term fluctuations and provides a clearer view of changes in market activity.

Common MAVOL settings include:
  • 5-period MAVOL: Reflects the average volume over the latest five periods and indicates short-term market activity.
  • 10-period MAVOL: Shows the medium-term volume trend.
  • 20-period MAVOL: Tracks volume over a longer period and reflects broader market participation.

When a short-term MAVOL crosses above a longer-term MAVOL, recent trading activity is increasing and market participation may be strengthening. Conversely, a downward crossover may indicate declining activity and weakening market interest.

3. How to Use MAVOL in Trading


A healthy uptrend with rising price and volume: When price and volume rise together, it indicates strong buying interest and suggests that the price may continue to climb. Volume bars that consistently remain above the volume moving average further confirm strong momentum.

A potential reversal following a high-volume decline: When the price breaks below a trendline or price moving average with a sharp increase in volume, it may signal further declines and a potential trend reversal. Traders should reassess their positions and manage risk accordingly.

Potential accumulation on gradually rising volume: After an extended period of low trading activity, a steady increase in volume may indicate accumulation by major market participants, particularly when volume bars gradually move above the volume moving average. The price may then rise with higher volume and pull back with lower volume, while upward momentum gradually strengthens.

A potential market top on extremely high volume: A sudden volume spike after a prolonged rally often reflects growing disagreement between buyers and sellers, as early investors begin taking profits. This may indicate that upward momentum is weakening. Conversely, extremely high volume after a steep decline may represent a final wave of selling, suggesting that a rebound or reversal could be approaching.

4. How to Set Up MAVOL on MEXC


Path: MEXC Official Website → Spot/Futures → Indicators → VOL

Follow these steps to add MAVOL to a chart on MEXC:

1) Open the candlestick chart for any trading pair and go to the indicator settings.
2) Select VOL under Sub Index. Volume bars will appear below the main chart.
3) Adjust the moving-average periods in the indicator settings. Common default periods are 5, 10 and 20, but you can customize them based on your trading style.
4) Short-term traders may use shorter periods for greater sensitivity, while medium- and long-term traders may choose longer periods to filter out market noise. Beginners are generally advised to start with the default settings and make adjustments only after becoming familiar with how the indicator behaves.


5. Limitations of MAVOL


1) MAVOL is a lagging indicator calculated from historical data. By the time a signal appears, the price may have already moved significantly.
2) Using MAVOL on its own may produce misleading signals. Consider combining it with support and resistance levels, the Relative Strength Index (RSI), Moving Average Convergence Divergence (MACD), and other technical tools.
3) Market news and broader conditions can also affect price and volume. Always use appropriate stop-loss measures and manage your risk carefully.

6. MAVOL FAQs


6.1 How should volume be used in trading?


The key is to analyze price and volume together. An increase in price is generally more convincing when supported by higher volume, while a decline on rising volume may signal stronger selling pressure. MAVOL can help filter out short-term fluctuations and reveal broader volume trends. Avoid making decisions based on a single volume bar.

6.2 How do I set up MAVOL?


Open the indicator settings on an MEXC chart, add the VOL indicator and configure the moving-average periods. Common settings are 5, 10 and 20 periods, representing short-, medium-, and longer-term volume trends.

6.3 Is volume analysis effective?


Volume can help confirm price movements and identify potential trend breakouts, changes in market participation and turning points. However, no indicator is reliable in every market condition. Combining volume analysis with other methods may improve the quality of trading decisions.

6.4 What is the difference between MAVOL and a price moving average?


A price moving average smooths price data to help identify the direction of a price trend. MAVOL smooths volume data to show changes in trading activity and market participation.

6.5 What does it mean when a short-term MAVOL crosses above a long-term MAVOL?


It usually means that recent trading activity is increasing and market participation is strengthening. If the price also breaks above a key resistance level, the potential trend signal may be more reliable.

MAVOL connects price movements with market participation. Understanding the relationship between price and volume can help traders better identify when a trend is beginning, continuing or losing momentum.


Risk Disclaimer: Technical indicators are calculated using historical data and are provided for reference only. They do not guarantee future market performance. Digital assets are highly volatile and involve significant risk. Always assess your risk tolerance carefully and avoid making trading decisions based solely on market trends or third-party opinions.

How to Use the Moving Average of Volume in Trading: A Complete Beginner's Guide

Key Takeaways

  • The volume indicator shows the total amount traded over a specific period and helps confirm the strength of price movements.
  • The Moving Average of Volume (MAVOL) smooths short-term fluctuations in trading volume. Common settings include 5, 10 and 20 periods.
  • You can add MAVOL through the indicator settings on MEXC and adjust the periods to suit your trading style.
  • MAVOL is a lagging indicator. Use it alongside other technical tools and always apply proper risk management and stop-loss measures.

1. What Is the Volume Indicator?


Volume is one of the most fundamental and important indicators in technical analysis. It represents the total amount of an asset traded within a specific period and is usually displayed as vertical bars below the price chart. A taller bar indicates higher trading activity, while a shorter bar suggests lower market participation.

2. What Is the Moving Average of Volume?


The Moving Average of Volume (MAVOL) is calculated by averaging trading volume over a specified number of periods.

Volume can fluctuate significantly from one period to another, making it difficult to identify the broader trend from volume bars alone. MAVOL smooths these short-term fluctuations and provides a clearer view of changes in market activity.

Common MAVOL settings include:
  • 5-period MAVOL: Reflects the average volume over the latest five periods and indicates short-term market activity.
  • 10-period MAVOL: Shows the medium-term volume trend.
  • 20-period MAVOL: Tracks volume over a longer period and reflects broader market participation.

When a short-term MAVOL crosses above a longer-term MAVOL, recent trading activity is increasing and market participation may be strengthening. Conversely, a downward crossover may indicate declining activity and weakening market interest.


3. How to Use MAVOL in Trading


A healthy uptrend with rising price and volume: When price and volume rise together, it indicates strong buying interest and suggests that the price may continue to climb. Volume bars that consistently remain above the volume moving average further confirm strong momentum.

A potential reversal following a high-volume decline: When the price breaks below a trendline or price moving average with a sharp increase in volume, it may signal further declines and a potential trend reversal. Traders should reassess their positions and manage risk accordingly.

Potential accumulation on gradually rising volume: After an extended period of low trading activity, a steady increase in volume may indicate accumulation by major market participants, particularly when volume bars gradually move above the volume moving average. The price may then rise with higher volume and pull back with lower volume, while upward momentum gradually strengthens.

A potential market top on extremely high volume: A sudden volume spike after a prolonged rally often reflects growing disagreement between buyers and sellers, as early investors begin taking profits. This may indicate that upward momentum is weakening. Conversely, extremely high volume after a steep decline may represent a final wave of selling, suggesting that a rebound or reversal could be approaching.

4. How to Set Up MAVOL on MEXC


Path: MEXC Official Website → Spot/Futures → Indicators → VOL

Follow these steps to add MAVOL to a chart on MEXC:

1) Open the candlestick chart for any trading pair and go to the indicator settings.
2) Select VOL under Sub Index. Volume bars will appear below the main chart.
3) Adjust the moving-average periods in the indicator settings. Common default periods are 5, 10 and 20, but you can customize them based on your trading style.
4) Short-term traders may use shorter periods for greater sensitivity, while medium- and long-term traders may choose longer periods to filter out market noise. Beginners are generally advised to start with the default settings and make adjustments only after becoming familiar with how the indicator behaves.


5. Limitations of MAVOL


1) MAVOL is a lagging indicator calculated from historical data. By the time a signal appears, the price may have already moved significantly.
2) Using MAVOL on its own may produce misleading signals. Consider combining it with support and resistance levels, the Relative Strength Index (RSI), Moving Average Convergence Divergence (MACD), and other technical tools.
3) Market news and broader conditions can also affect price and volume. Always use appropriate stop-loss measures and manage your risk carefully.

6. MAVOL FAQs


6.1 How should volume be used in trading?


The key is to analyze price and volume together. An increase in price is generally more convincing when supported by higher volume, while a decline on rising volume may signal stronger selling pressure. MAVOL can help filter out short-term fluctuations and reveal broader volume trends. Avoid making decisions based on a single volume bar.

6.2 How do I set up MAVOL?


Open the indicator settings on an MEXC chart, add the VOL indicator and configure the moving-average periods. Common settings are 5, 10 and 20 periods, representing short-, medium-, and longer-term volume trends.

6.3 Is volume analysis effective?


Volume can help confirm price movements and identify potential trend breakouts, changes in market participation and turning points. However, no indicator is reliable in every market condition. Combining volume analysis with other methods may improve the quality of trading decisions.

6.4 What is the difference between MAVOL and a price moving average?


A price moving average smooths price data to help identify the direction of a price trend. MAVOL smooths volume data to show changes in trading activity and market participation.

6.5 What does it mean when a short-term MAVOL crosses above a long-term MAVOL?


It usually means that recent trading activity is increasing and market participation is strengthening. If the price also breaks above a key resistance level, the potential trend signal may be more reliable.

MAVOL connects price movements with market participation. Understanding the relationship between price and volume can help traders better identify when a trend is beginning, continuing or losing momentum.


Risk Disclaimer: Technical indicators are calculated using historical data and are provided for reference only. They do not guarantee future market performance. Digital assets are highly volatile and involve significant risk. Always assess your risk tolerance carefully and avoid making trading decisions based solely on market trends or third-party opinions.