क्रिप्टो खरीदें
मार्केट
स्पॉट
फ़्यूचर्सBTC
कमाएँ
इवेंट सेंटर
रिवॉर्ड हब
अधिक
How to Use the Parabolic SAR Indicator in Trading: A Complete Beginner's GuideHow to Use the Parabolic SAR Indicator in Trading: A Complete Beginner's Guide
कैटेगरी की लिस्ट
कैंसिल करें

How to Use the Parabolic SAR Indicator in Trading: A Complete Beginner's Guide

Key Takeaways

  • The Parabolic SAR is a trend-following indicator developed by J. Welles Wilder. It uses dots above or below the price to indicate the direction of the market trend.
  • Dots below the price indicate an uptrend, while dots above the price indicate a downtrend. A change in the position of the dots may signal a potential trend reversal.
  • The main uses of the Parabolic SAR include identifying trends, setting trailing stops, and finding potential entry and exit points.
  • The indicator may generate false signals in sideways markets, so it is recommended to use it with tools such as the Average Directional Index.

1. What Is the Parabolic SAR Indicator?


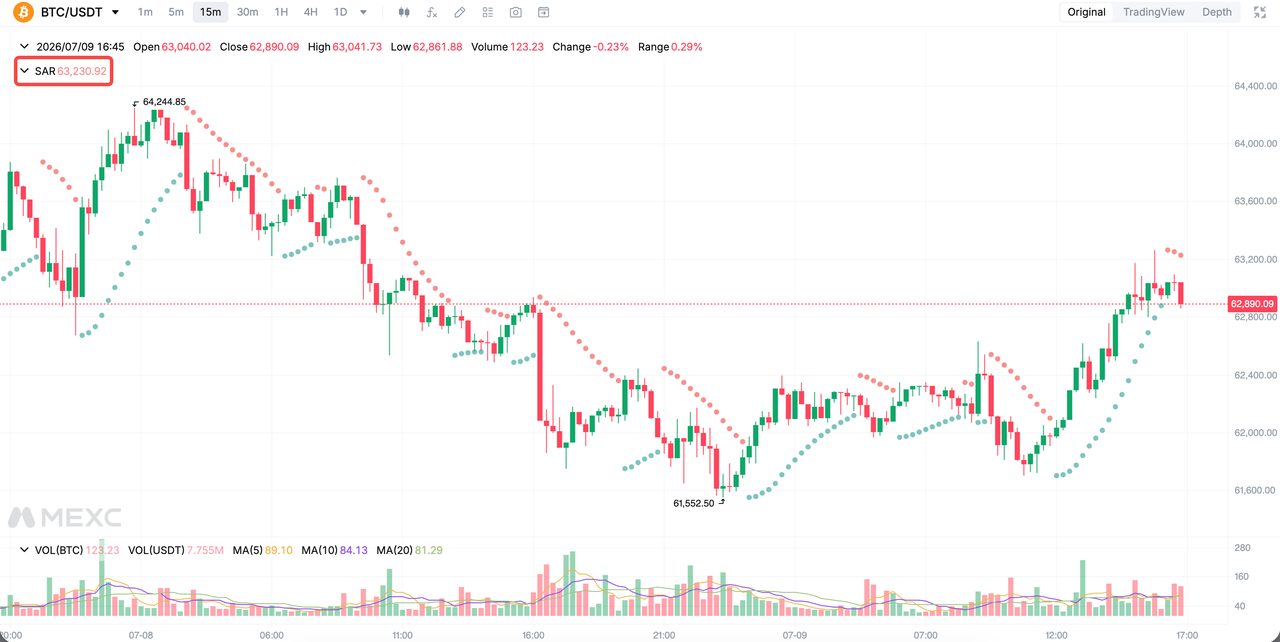
The Parabolic Stop and Reverse indicator, commonly known as the Parabolic SAR, is a trend-following tool developed by renowned technical analyst J. Welles Wilder, who also created the Relative Strength Index. The indicator appears on a chart as a series of dots above or below the price. It is named after the parabolic shape formed by these dots.

The indicator is relatively easy to interpret. When the dots appear below the price, the market is considered to be in an uptrend, and traders may prefer to hold long positions. When the dots appear above the price, the market is considered to be in a downtrend, and traders may prefer to hold short positions or stay on the sidelines. When the price crosses the dots and the dots move to the opposite side of the price, it may indicate a potential trend reversal.

2. Parabolic SAR Formula


The Parabolic SAR calculation is based on two key variables: the extreme point and the acceleration factor.
  • Uptrend formula: Current SAR = Previous SAR + Previous acceleration factor × (Previous extreme point - Previous SAR)
  • Downtrend formula: Current SAR = Previous SAR - Previous acceleration factor × (Previous SAR - Previous extreme point)

In an uptrend, the extreme point refers to the highest price. In a downtrend, it refers to the lowest price. The acceleration factor defaults to 0.02 and increases by 0.02 whenever a new extreme point is reached, up to a maximum of 0.20. As the trend continues, the indicator moves progressively closer to the price. Users do not need to calculate the indicator manually, as it can be loaded automatically on MEXC market charts.

3. How to Use the Parabolic SAR Indicator in Trading


3.1 Identify the trend direction


This is the most basic function of the indicator. After opening a chart, traders can quickly identify whether the current trend is bullish or bearish by observing whether the dots are above or below the price. This can help traders avoid taking positions against the prevailing trend.

3.2 Set a trailing stop


The Parabolic SAR can also function as a dynamic trailing stop. During an uptrend, the dots move higher as the price rises. Traders may place a stop-loss at the latest dot, helping them lock in profits while the trend continues and exit when the trend breaks down.

3.3 Identify reversal signals


When the price falls below the dots during an uptrend, the dots move above the price, which may signal that traders should close long positions and consider opening short positions. When the price rises above the dots during a downtrend, the dots move below the price, which may signal that traders should close short positions and consider opening long positions. This is the core logic behind the stop-and-reverse system, allowing traders to continue following the market trend.

4. How to Use the Parabolic SAR on MEXC


Go to the MEXC Spot or Futures trading page, open the candlestick chart, and click Indicators. Search for and add the Parabolic SAR indicator, then customize its parameters in the settings.


5. Advantages, Limitations, and Tips for Using the Parabolic SAR


Advantages: The signals are clear and easy to interpret, helping traders focus on the direction of the trend. The indicator automatically provides potential exit levels and can help manage risk. It performs particularly well in strong, trending markets.

Limitations: The Parabolic SAR is a lagging indicator, so its signals may be delayed. In sideways markets, the dots may frequently switch above and below the price, generating numerous false signals. Relying on the indicator alone may lead to repeated losses.

It is recommended to combine the Parabolic SAR with other indicators. For example, traders may use the Average Directional Index to confirm trend strength and only act on signals when the trend is strong. They may also use moving averages to filter the trend direction and trade only in line with the broader market trend. Any strategy should also be supported by sound position sizing and risk management.

6. Parabolic SAR FAQ


6.1 What is the Parabolic SAR indicator?


The Parabolic SAR is a trend-following indicator that uses dots above or below the price to show the trend direction and potential reversal points. It can also be used as a trailing stop tool.

6.2 How can I use the Parabolic SAR effectively?


First, use the position of the dots to identify the trend direction and enter trades in line with the trend. The latest dot can be used as a reference when setting a stop-loss. When the dots move to the opposite side of the price, consider exiting the position or reversing direction. Other indicators should also be used to filter false signals in sideways markets.

6.3 What are the best Parabolic SAR settings?


The default acceleration factor is 0.02, with a maximum value of 0.20. These settings are suitable for most market conditions. Short-term traders may increase the acceleration factor, while longer-term traders may reduce it.

6.4 Can the Parabolic SAR be used on 1-minute and 5-minute charts?


Yes. The indicator can be used on all timeframes, and day traders commonly use it to 1-minute and 5-minute charts. However, shorter timeframes contain more market noise, so it is recommended to combine the indicator with a trend confirmation tool.

6.5 What are some common Parabolic SAR strategies?


Common strategies include trend following strategies, dual-timeframe strategies that use a longer timeframe to determine direction and a shorter timeframe to identify entry points, and filtering strategies that combine the Parabolic SAR with the Average Directional Index.

6.6 What is the 7% stop-loss rule?


The 7% stop-loss rule is a fixed-percentage risk management method. It requires traders to exit a position when the loss reaches 7% of the purchase price. The Parabolic SAR, by comparison, provides a dynamic stop-loss level. The two approaches can also be combined.


Risk Warning: Technical indicators are based on historical data and do not guarantee future performance. Digital assets are highly volatile. Trade cautiously based on your risk tolerance and avoid blindly following market trends.

How to Use the Parabolic SAR Indicator in Trading: A Complete Beginner's Guide

Key Takeaways

  • The Parabolic SAR is a trend-following indicator developed by J. Welles Wilder. It uses dots above or below the price to indicate the direction of the market trend.
  • Dots below the price indicate an uptrend, while dots above the price indicate a downtrend. A change in the position of the dots may signal a potential trend reversal.
  • The main uses of the Parabolic SAR include identifying trends, setting trailing stops, and finding potential entry and exit points.
  • The indicator may generate false signals in sideways markets, so it is recommended to use it with tools such as the Average Directional Index.

1. What Is the Parabolic SAR Indicator?


The Parabolic Stop and Reverse indicator, commonly known as the Parabolic SAR, is a trend-following tool developed by renowned technical analyst J. Welles Wilder, who also created the Relative Strength Index. The indicator appears on a chart as a series of dots above or below the price. It is named after the parabolic shape formed by these dots.

The indicator is relatively easy to interpret. When the dots appear below the price, the market is considered to be in an uptrend, and traders may prefer to hold long positions. When the dots appear above the price, the market is considered to be in a downtrend, and traders may prefer to hold short positions or stay on the sidelines. When the price crosses the dots and the dots move to the opposite side of the price, it may indicate a potential trend reversal.


2. Parabolic SAR Formula


The Parabolic SAR calculation is based on two key variables: the extreme point and the acceleration factor.
  • Uptrend formula: Current SAR = Previous SAR + Previous acceleration factor × (Previous extreme point - Previous SAR)
  • Downtrend formula: Current SAR = Previous SAR - Previous acceleration factor × (Previous SAR - Previous extreme point)

In an uptrend, the extreme point refers to the highest price. In a downtrend, it refers to the lowest price. The acceleration factor defaults to 0.02 and increases by 0.02 whenever a new extreme point is reached, up to a maximum of 0.20. As the trend continues, the indicator moves progressively closer to the price. Users do not need to calculate the indicator manually, as it can be loaded automatically on MEXC market charts.

3. How to Use the Parabolic SAR Indicator in Trading


3.1 Identify the trend direction


This is the most basic function of the indicator. After opening a chart, traders can quickly identify whether the current trend is bullish or bearish by observing whether the dots are above or below the price. This can help traders avoid taking positions against the prevailing trend.

3.2 Set a trailing stop


The Parabolic SAR can also function as a dynamic trailing stop. During an uptrend, the dots move higher as the price rises. Traders may place a stop-loss at the latest dot, helping them lock in profits while the trend continues and exit when the trend breaks down.

3.3 Identify reversal signals


When the price falls below the dots during an uptrend, the dots move above the price, which may signal that traders should close long positions and consider opening short positions. When the price rises above the dots during a downtrend, the dots move below the price, which may signal that traders should close short positions and consider opening long positions. This is the core logic behind the stop-and-reverse system, allowing traders to continue following the market trend.

4. How to Use the Parabolic SAR on MEXC


Go to the MEXC Spot or Futures trading page, open the candlestick chart, and click Indicators. Search for and add the Parabolic SAR indicator, then customize its parameters in the settings.


5. Advantages, Limitations, and Tips for Using the Parabolic SAR


Advantages: The signals are clear and easy to interpret, helping traders focus on the direction of the trend. The indicator automatically provides potential exit levels and can help manage risk. It performs particularly well in strong, trending markets.

Limitations: The Parabolic SAR is a lagging indicator, so its signals may be delayed. In sideways markets, the dots may frequently switch above and below the price, generating numerous false signals. Relying on the indicator alone may lead to repeated losses.

It is recommended to combine the Parabolic SAR with other indicators. For example, traders may use the Average Directional Index to confirm trend strength and only act on signals when the trend is strong. They may also use moving averages to filter the trend direction and trade only in line with the broader market trend. Any strategy should also be supported by sound position sizing and risk management.

6. Parabolic SAR FAQ


6.1 What is the Parabolic SAR indicator?


The Parabolic SAR is a trend-following indicator that uses dots above or below the price to show the trend direction and potential reversal points. It can also be used as a trailing stop tool.

6.2 How can I use the Parabolic SAR effectively?


First, use the position of the dots to identify the trend direction and enter trades in line with the trend. The latest dot can be used as a reference when setting a stop-loss. When the dots move to the opposite side of the price, consider exiting the position or reversing direction. Other indicators should also be used to filter false signals in sideways markets.

6.3 What are the best Parabolic SAR settings?


The default acceleration factor is 0.02, with a maximum value of 0.20. These settings are suitable for most market conditions. Short-term traders may increase the acceleration factor, while longer-term traders may reduce it.

6.4 Can the Parabolic SAR be used on 1-minute and 5-minute charts?


Yes. The indicator can be used on all timeframes, and day traders commonly use it to 1-minute and 5-minute charts. However, shorter timeframes contain more market noise, so it is recommended to combine the indicator with a trend confirmation tool.

6.5 What are some common Parabolic SAR strategies?


Common strategies include trend following strategies, dual-timeframe strategies that use a longer timeframe to determine direction and a shorter timeframe to identify entry points, and filtering strategies that combine the Parabolic SAR with the Average Directional Index.

6.6 What is the 7% stop-loss rule?


The 7% stop-loss rule is a fixed-percentage risk management method. It requires traders to exit a position when the loss reaches 7% of the purchase price. The Parabolic SAR, by comparison, provides a dynamic stop-loss level. The two approaches can also be combined.


Risk Warning: Technical indicators are based on historical data and do not guarantee future performance. Digital assets are highly volatile. Trade cautiously based on your risk tolerance and avoid blindly following market trends.