क्रिप्टो खरीदें
मार्केट
स्पॉट
फ़्यूचर्सBTC
कमाएँ
इवेंट सेंटर
रिवॉर्ड हब
अधिक
How to Use the Relative Strength Index (RSI) in Trading: A Complete Beginner's GuideHow to Use the Relative Strength Index (RSI) in Trading: A Complete Beginner's Guide
कैटेगरी की लिस्ट
कैंसिल करें

How to Use the Relative Strength Index (RSI) in Trading: A Complete Beginner's Guide

Key Takeaways

  • The Relative Strength Index (RSI) is a momentum oscillator that measures the speed and magnitude of price changes on a scale of 0 to 100.
  • Readings above 70 are generally considered overbought, while readings below 30 are generally considered oversold. These levels are reference points rather than standalone trading signals.
  • RSI divergence may provide an early indication that a trend is losing momentum, but additional confirmation is required.
  • The standard setting is 14 periods. Traders may adjust the period and thresholds according to their timeframe, trading style, and market volatility.
  • RSI can be added to candlestick charts on MEXC and should be used together with other indicators and appropriate risk management.

1. What Is the Relative Strength Index?


The Relative Strength Index, or RSI, is a momentum indicator developed by technical analyst J. Welles Wilder Jr. and introduced in 1978. It is widely used across cryptocurrency, stock, and foreign exchange markets.

RSI compares the average gains and average losses over a specified period and converts the result into a value between 0 and 100. In simple terms, it helps traders assess whether buying or selling momentum may have pushed the market to a short-term extreme.
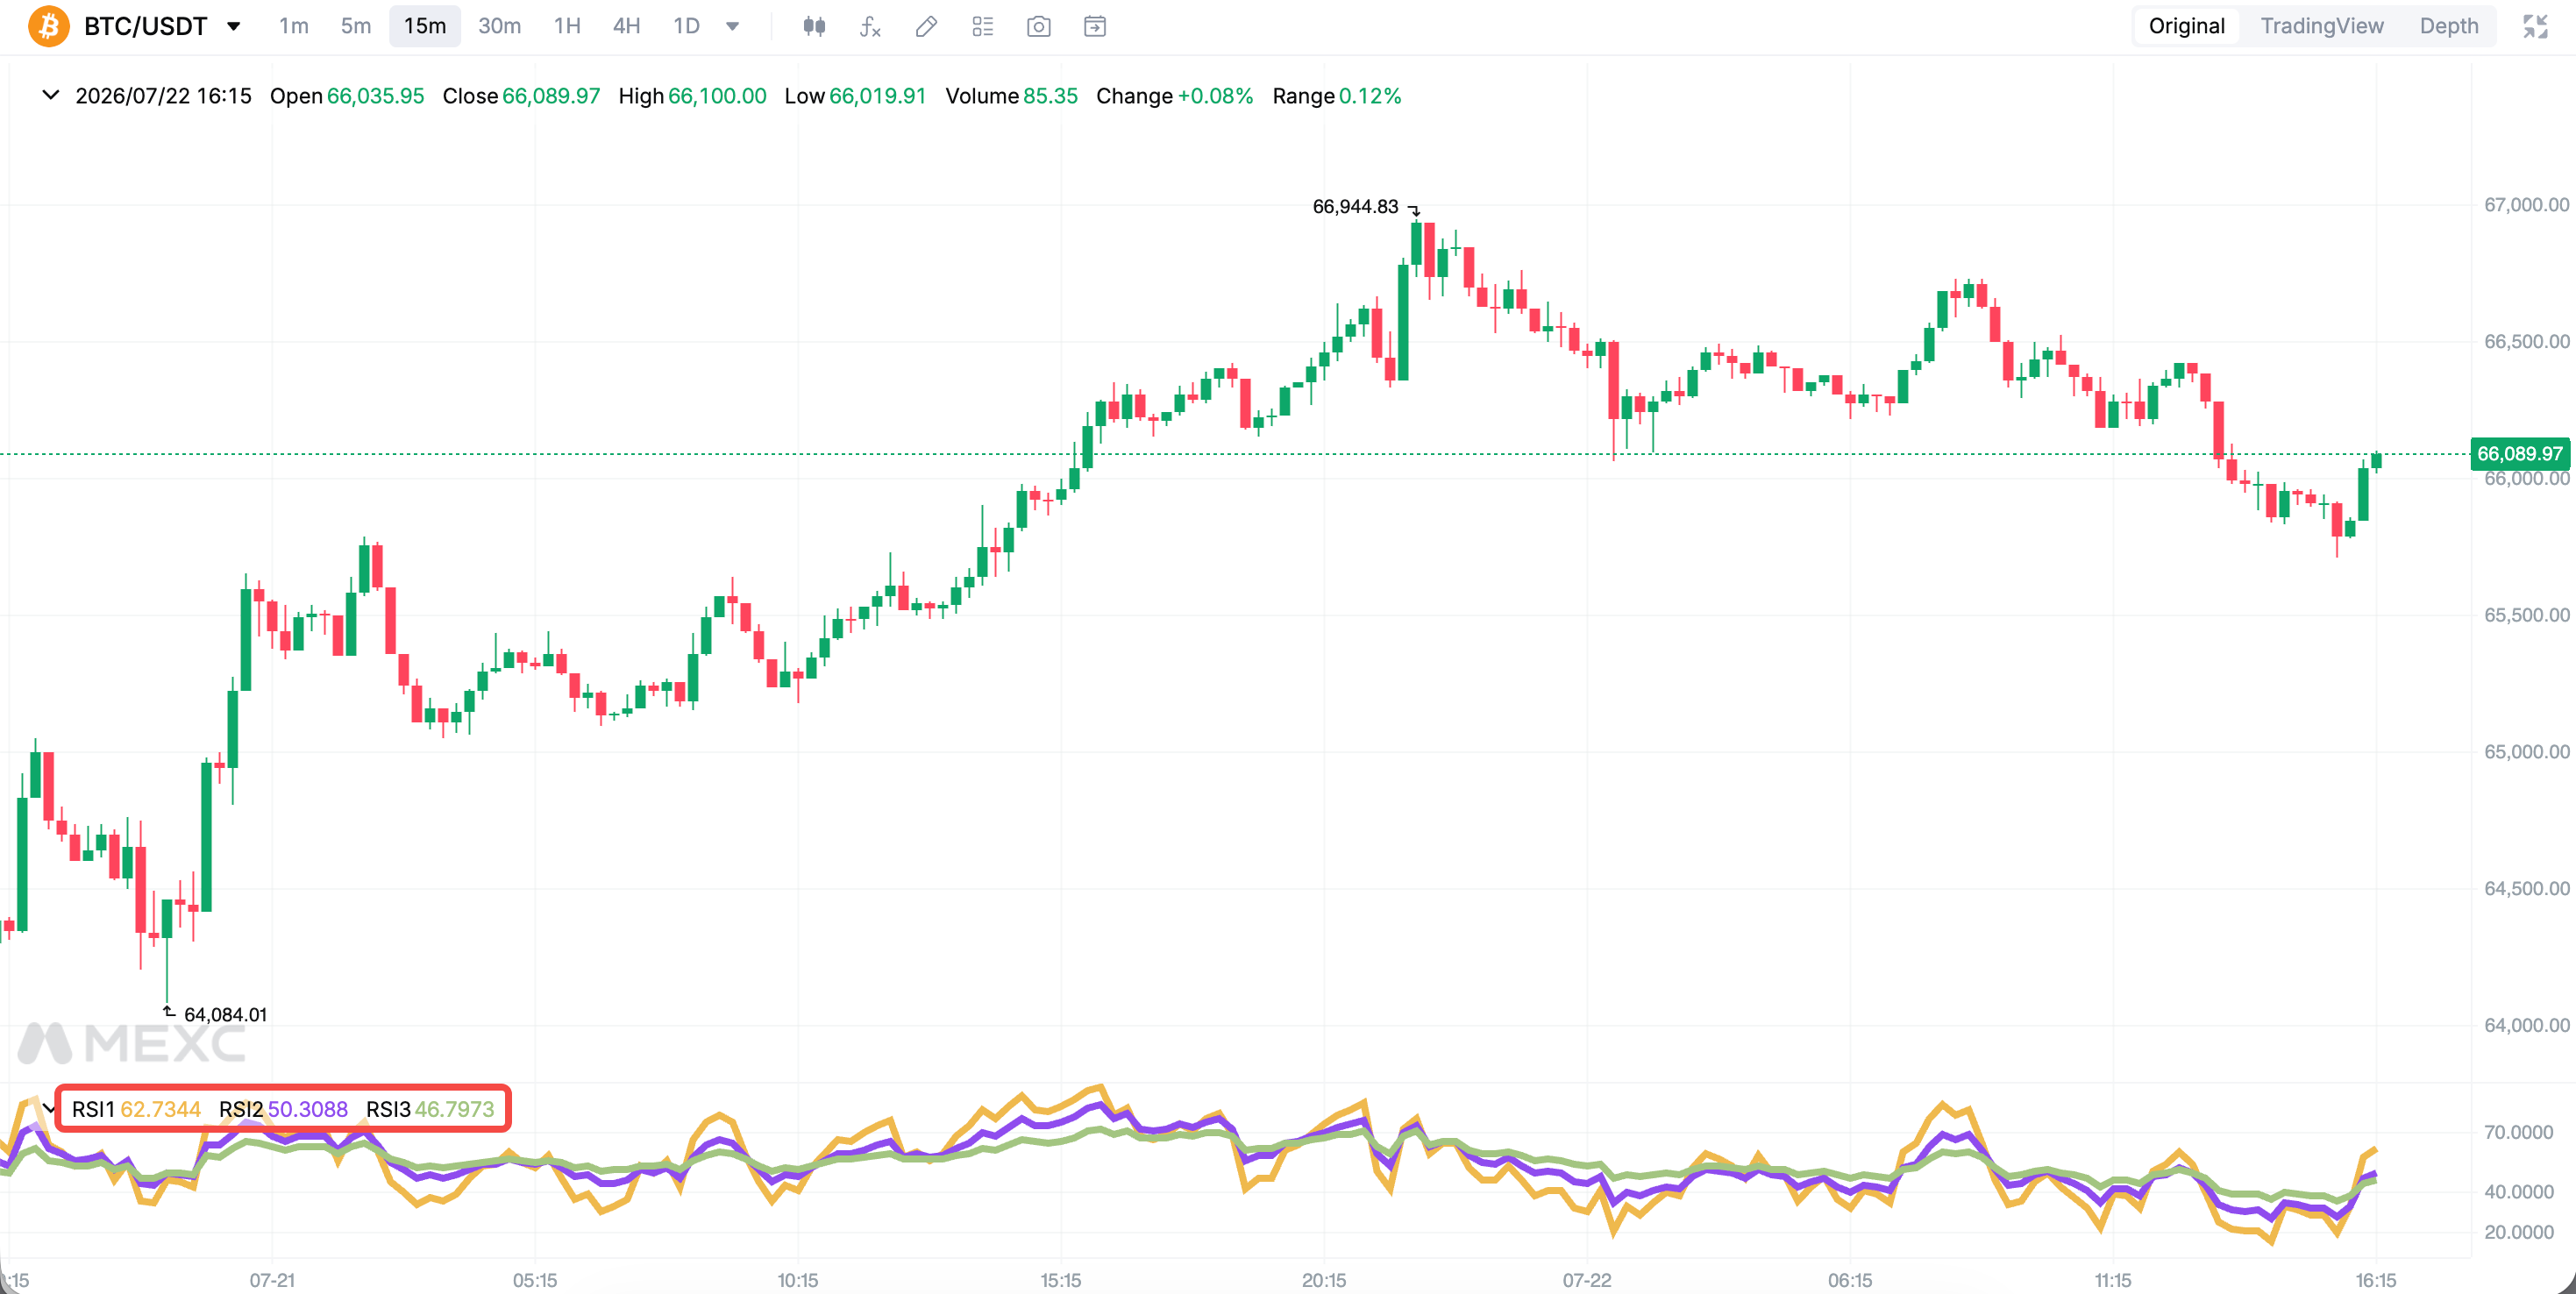

2. How to Read Overbought and Oversold Conditions


RSI is commonly interpreted using the following reference levels:

  • RSI above 70, overbought: The price may have risen too quickly, which can increase the risk of a short-term pullback. Traders should avoid treating this reading as an automatic reason to sell.
  • RSI below 30, oversold: The price may have fallen sharply, which can create the possibility of a short-term rebound. Traders should wait for confirmation before considering an entry.
  • RSI around 50: The 50 level is often used as a momentum midpoint. Readings above 50 may indicate stronger bullish momentum, while readings below 50 may indicate stronger bearish momentum.

During a strong trend, RSI can remain overbought or oversold for an extended period without a reversal. In highly volatile cryptocurrency markets, some traders use 80 and 20 as alternative thresholds to help filter out weaker signals. No threshold is universally best, and the choice should reflect the trader's timeframe and strategy.

3. How to Interpret Potential Buy and Sell Signals


A common beginner mistake is to place a trade as soon as RSI enters the overbought or oversold zone. A more cautious approach is to wait for the indicator to move back across the relevant threshold:
  • Potential bullish signal: RSI falls below 30 and then rises back above 30. This may indicate that bearish momentum is weakening and buying pressure is beginning to recover.
  • Potential bearish signal: RSI rises above 70 and then falls back below 70. This may indicate that bullish momentum is weakening and traders may consider reducing exposure or waiting for further confirmation.

RSI ranges may also shift with the broader trend. During an uptrend, RSI often moves between 40 and 90, with the 40–50 range potentially acting as momentum support. During a downtrend, RSI often moves between 10 and 60, with the 50–60 range potentially acting as momentum resistance. These ranges can help provide context, but they do not guarantee that the prevailing trend will continue.

4. RSI Divergence: Potential Reversal Signals


  • Bullish divergence: The price forms a lower low while RSI forms a higher low. This may indicate that bearish momentum is weakening and that a potential upward reversal is developing.
  • Bearish divergence: The price forms a higher high while RSI forms a lower high. This may indicate that bullish momentum is weakening and that a potential downward reversal is developing.

Divergence can appear before a visible reversal on the price chart, but it may also persist or fail. Traders should confirm it with price structure, volume, or other indicators before entering a position.

5. Indicators to Use With RSI


RSI should not be used as the sole basis for a trading decision. Common confirmation tools include:

  • RSI and Moving Average Convergence Divergence (MACD): RSI helps identify momentum extremes, while MACD can help confirm trend direction and momentum changes.
  • RSI and moving averages: Moving averages can help identify the prevailing trend, allowing traders to focus on RSI signals that align with that direction. For example, during an uptrend, a trader may monitor RSI as it recovers from an oversold reading.
  • RSI and support or resistance: An RSI signal that occurs near an established support or resistance level may provide stronger context than the indicator reading alone.

Regardless of the combination used, traders should set appropriate stop-loss levels and manage position size. Beginners may consider testing a strategy with small amounts before committing more capital.

6. How to Set Up RSI on MEXC


Navigation: MEXC website → Spot or Futures → Indicators → RSI


7. Important Notes and Risks


1. RSI is a lagging indicator calculated from historical price data. It cannot predict future market movements with certainty.
2. Overbought and oversold signals may fail during strong trends. Avoid trading against the prevailing trend without additional confirmation.
3. Shorter periods make RSI more responsive but also increase noise and the risk of false signals. Intraday traders should apply stricter risk controls.
4. Technical analysis is a supporting tool rather than a complete trading system. Trade according to your risk tolerance and only commit an amount you can afford to lose.

8. RSI FAQ


8.1 How do I use RSI?


Add RSI to a candlestick chart on MEXC and monitor its value. Readings above 70 are generally considered overbought, while readings below 30 are generally considered oversold. Use divergence, the broader trend, and other indicators to confirm potential signals before placing a trade.

8.2 What are the potential buy and sell signals for RSI?


A potential bullish signal may occur when RSI falls below 30 and then moves back above 30. A potential bearish signal may occur when RSI rises above 70 and then moves back below 70. Bullish and bearish divergences may also indicate possible reversals, but none of these signals should be used alone.

8.3 Is RSI suitable for day trading?


It can be. Some day traders use shorter settings, such as 7 or 9 periods, to make RSI more responsive. However, shorter settings also produce more noise and false signals. Traders should use support and resistance levels, additional confirmation, and strict stop-loss rules.

8.4 Which indicator works well with RSI?


MACD is commonly used with RSI because RSI measures momentum conditions while MACD helps confirm trend direction and momentum changes. Moving averages and Bollinger Bands can also provide useful confirmation. No single combination is universally best.


Risk Warning: Technical indicators are based on historical data and do not guarantee future performance. Digital assets are highly volatile, and trading involves risk. Make decisions carefully based on your risk tolerance and avoid blindly following market trends.

How to Use the Relative Strength Index (RSI) in Trading: A Complete Beginner's Guide

Key Takeaways

  • The Relative Strength Index (RSI) is a momentum oscillator that measures the speed and magnitude of price changes on a scale of 0 to 100.
  • Readings above 70 are generally considered overbought, while readings below 30 are generally considered oversold. These levels are reference points rather than standalone trading signals.
  • RSI divergence may provide an early indication that a trend is losing momentum, but additional confirmation is required.
  • The standard setting is 14 periods. Traders may adjust the period and thresholds according to their timeframe, trading style, and market volatility.
  • RSI can be added to candlestick charts on MEXC and should be used together with other indicators and appropriate risk management.

1. What Is the Relative Strength Index?


The Relative Strength Index, or RSI, is a momentum indicator developed by technical analyst J. Welles Wilder Jr. and introduced in 1978. It is widely used across cryptocurrency, stock, and foreign exchange markets.

RSI compares the average gains and average losses over a specified period and converts the result into a value between 0 and 100. In simple terms, it helps traders assess whether buying or selling momentum may have pushed the market to a short-term extreme.


2. How to Read Overbought and Oversold Conditions


RSI is commonly interpreted using the following reference levels:

  • RSI above 70, overbought: The price may have risen too quickly, which can increase the risk of a short-term pullback. Traders should avoid treating this reading as an automatic reason to sell.
  • RSI below 30, oversold: The price may have fallen sharply, which can create the possibility of a short-term rebound. Traders should wait for confirmation before considering an entry.
  • RSI around 50: The 50 level is often used as a momentum midpoint. Readings above 50 may indicate stronger bullish momentum, while readings below 50 may indicate stronger bearish momentum.

During a strong trend, RSI can remain overbought or oversold for an extended period without a reversal. In highly volatile cryptocurrency markets, some traders use 80 and 20 as alternative thresholds to help filter out weaker signals. No threshold is universally best, and the choice should reflect the trader's timeframe and strategy.

3. How to Interpret Potential Buy and Sell Signals


A common beginner mistake is to place a trade as soon as RSI enters the overbought or oversold zone. A more cautious approach is to wait for the indicator to move back across the relevant threshold:
  • Potential bullish signal: RSI falls below 30 and then rises back above 30. This may indicate that bearish momentum is weakening and buying pressure is beginning to recover.
  • Potential bearish signal: RSI rises above 70 and then falls back below 70. This may indicate that bullish momentum is weakening and traders may consider reducing exposure or waiting for further confirmation.

RSI ranges may also shift with the broader trend. During an uptrend, RSI often moves between 40 and 90, with the 40–50 range potentially acting as momentum support. During a downtrend, RSI often moves between 10 and 60, with the 50–60 range potentially acting as momentum resistance. These ranges can help provide context, but they do not guarantee that the prevailing trend will continue.

4. RSI Divergence: Potential Reversal Signals


  • Bullish divergence: The price forms a lower low while RSI forms a higher low. This may indicate that bearish momentum is weakening and that a potential upward reversal is developing.
  • Bearish divergence: The price forms a higher high while RSI forms a lower high. This may indicate that bullish momentum is weakening and that a potential downward reversal is developing.

Divergence can appear before a visible reversal on the price chart, but it may also persist or fail. Traders should confirm it with price structure, volume, or other indicators before entering a position.

5. Indicators to Use With RSI


RSI should not be used as the sole basis for a trading decision. Common confirmation tools include:

  • RSI and Moving Average Convergence Divergence (MACD): RSI helps identify momentum extremes, while MACD can help confirm trend direction and momentum changes.
  • RSI and moving averages: Moving averages can help identify the prevailing trend, allowing traders to focus on RSI signals that align with that direction. For example, during an uptrend, a trader may monitor RSI as it recovers from an oversold reading.
  • RSI and support or resistance: An RSI signal that occurs near an established support or resistance level may provide stronger context than the indicator reading alone.

Regardless of the combination used, traders should set appropriate stop-loss levels and manage position size. Beginners may consider testing a strategy with small amounts before committing more capital.

6. How to Set Up RSI on MEXC


Navigation: MEXC website → Spot or Futures → Indicators → RSI


7. Important Notes and Risks


1. RSI is a lagging indicator calculated from historical price data. It cannot predict future market movements with certainty.
2. Overbought and oversold signals may fail during strong trends. Avoid trading against the prevailing trend without additional confirmation.
3. Shorter periods make RSI more responsive but also increase noise and the risk of false signals. Intraday traders should apply stricter risk controls.
4. Technical analysis is a supporting tool rather than a complete trading system. Trade according to your risk tolerance and only commit an amount you can afford to lose.

8. RSI FAQ


8.1 How do I use RSI?


Add RSI to a candlestick chart on MEXC and monitor its value. Readings above 70 are generally considered overbought, while readings below 30 are generally considered oversold. Use divergence, the broader trend, and other indicators to confirm potential signals before placing a trade.

8.2 What are the potential buy and sell signals for RSI?


A potential bullish signal may occur when RSI falls below 30 and then moves back above 30. A potential bearish signal may occur when RSI rises above 70 and then moves back below 70. Bullish and bearish divergences may also indicate possible reversals, but none of these signals should be used alone.

8.3 Is RSI suitable for day trading?


It can be. Some day traders use shorter settings, such as 7 or 9 periods, to make RSI more responsive. However, shorter settings also produce more noise and false signals. Traders should use support and resistance levels, additional confirmation, and strict stop-loss rules.

8.4 Which indicator works well with RSI?


MACD is commonly used with RSI because RSI measures momentum conditions while MACD helps confirm trend direction and momentum changes. Moving averages and Bollinger Bands can also provide useful confirmation. No single combination is universally best.


Risk Warning: Technical indicators are based on historical data and do not guarantee future performance. Digital assets are highly volatile, and trading involves risk. Make decisions carefully based on your risk tolerance and avoid blindly following market trends.