क्रिप्टो खरीदें
मार्केट
स्पॉट
फ़्यूचर्सBTC
कमाएँ
इवेंट सेंटर
रिवॉर्ड हब
अधिक
How to Use the Triple Exponential Average (TRIX) in Trading: A Complete Beginner's GuideHow to Use the Triple Exponential Average (TRIX) in Trading: A Complete Beginner's Guide
कैटेगरी की लिस्ट
कैंसिल करें

How to Use the Triple Exponential Average (TRIX) in Trading: A Complete Beginner's Guide

Content Overview

  • The Triple Exponential Average (TRIX) uses triple exponential smoothing to filter out market noise and help identify trend direction.
  • TRIX oscillates around the zero line. Positive values indicate bullish momentum, while negative values indicate bearish momentum.
  • Common TRIX trading signals include zero-line crossovers, signal-line crossovers, and divergence.
  • The indicator period can be adjusted to suit different trading styles, with shorter periods suited to short-term trading and longer periods suited to swing trading.
  • Users can add TRIX to the charting tools on MEXC and combine it with other analytical tools to support trading decisions.

1. What Is the Triple Exponential Average?


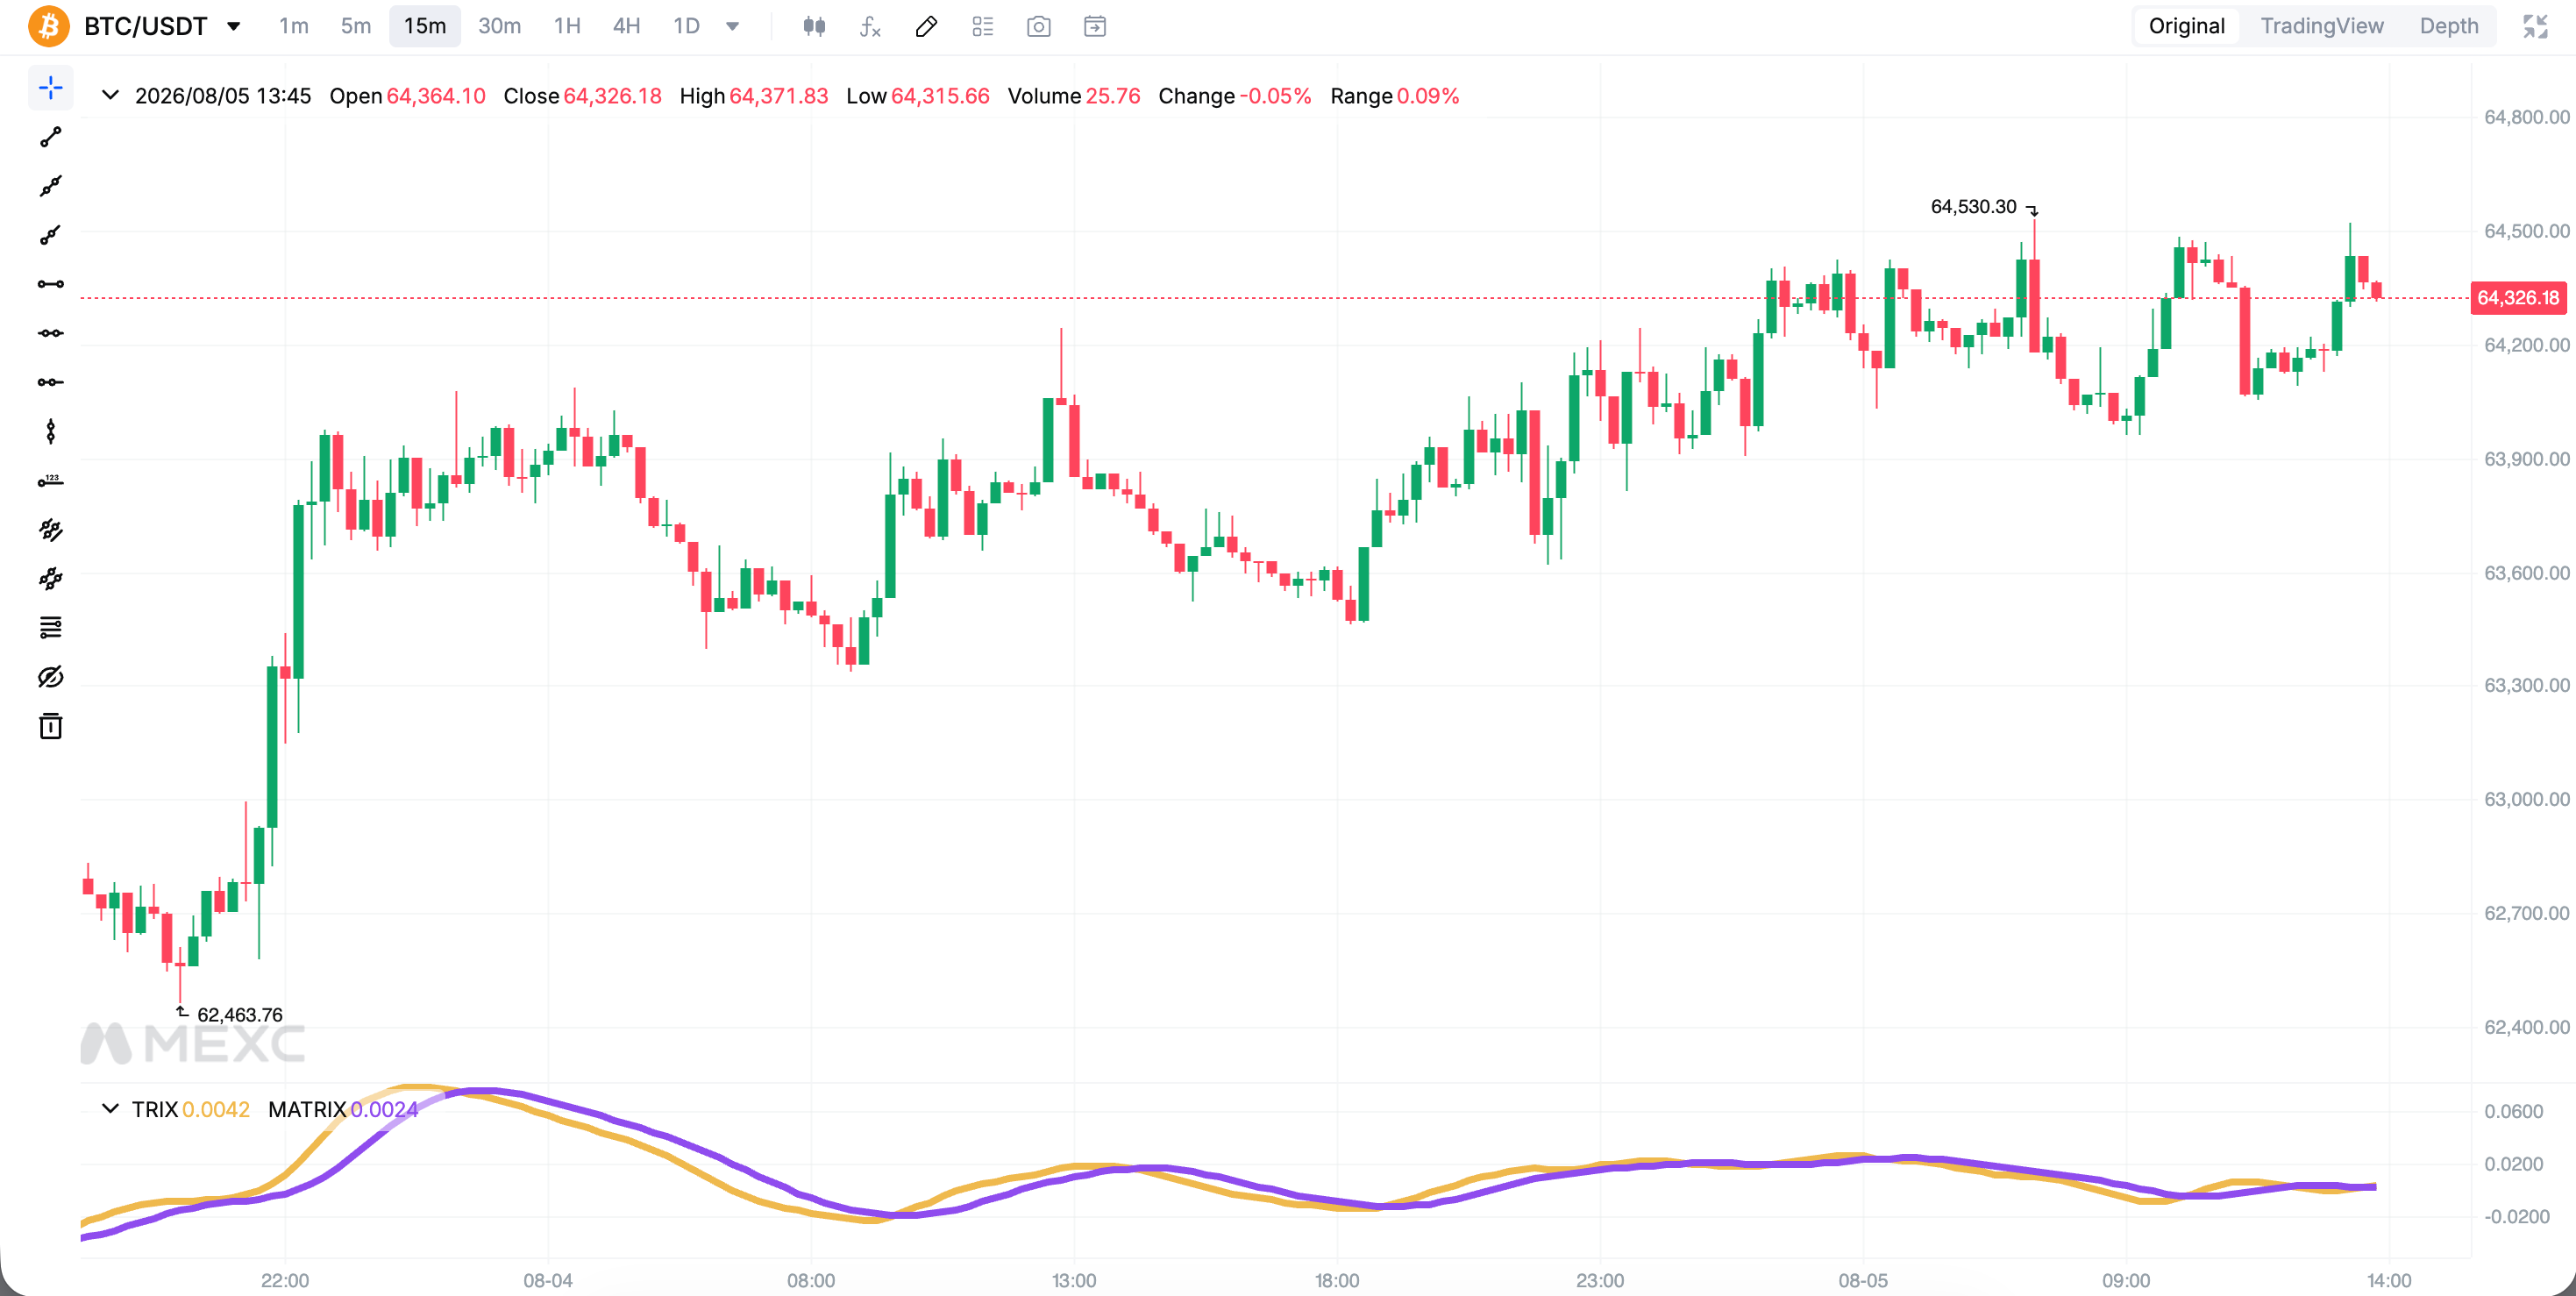
The Triple Exponential Average (TRIX), developed by Jack Hutson in the 1980s, is a widely used technical analysis indicator. It calculates the percentage rate of change of a triple-smoothed exponential moving average, filtering out short-term price fluctuations and insignificant noise to show the market's primary trend more clearly.

The indicator is based on three rounds of smoothing. First, an Exponential Moving Average is calculated using closing prices. The result is then smoothed a second and third time. This multilayered smoothing significantly reduces the impact of minor fluctuations, allowing traders to focus on more meaningful trend changes. Similar to the Moving Average Convergence Divergence, TRIX can help assess overbought and oversold conditions and generate potential buy and sell signals.

2. How to Use the Triple Exponential Average in Trading


2.1 Zero-line crossover signals


When the TRIX line crosses above the zero line, momentum shifts from negative to positive, which may indicate the beginning of an uptrend. Traders may consider looking for potential buying opportunities. When the TRIX line crosses below the zero line, momentum is weakening, and traders may consider reducing their positions or looking for potential selling opportunities.

2.2 Signal-line crossover signals


Traders often overlay a signal line on TRIX, typically a 9-period Exponential Moving Average of the indicator itself. A crossover above the signal line is generally considered bullish, while a crossover below it is considered bearish.

This method can be used in both trending and range-bound markets. In a range-bound market, it may help confirm support and resistance areas. In a trending market, it may help confirm that a pullback has ended and the primary trend is resuming.

2.3 Divergence signals


Divergence is an important tool for identifying potential trend reversals. When price forms a lower low while TRIX forms a higher low, a bullish divergence occurs, suggesting that bearish momentum may be fading and price could reverse upward. When price forms a higher high while TRIX forms a lower high, a bearish divergence occurs, suggesting that the uptrend may be weakening.

3. Advantages and Limitations of the TRIX Indicator


Advantages:

  • Triple smoothing effectively filters out noise and produces clearer signals.
  • Divergence can help provide early warning of potential trend reversals.
  • Flexible parameters can be adapted to different time frames and trading styles.

Limitations:

  • As a lagging indicator based on moving averages, TRIX may produce delayed signals during rapid market reversals.
  • It can generate false signals in range-bound markets.
  • Parameter selection involves a degree of subjectivity.

It is recommended to combine TRIX with other analytical methods, such as the Relative Strength Index, volume indicators, and support and resistance levels. Traders should also set strict stop-loss orders and manage position risk carefully.

4. How to Use TRIX on MEXC


MEXC offers comprehensive charting tools, allowing users to customize TRIX settings and combine it with other technical indicators.

Navigation: MEXC website → Spot/Futures → Indicators → TRIX

Whether trading Spot or Futures, combining zero-line crossovers, signal-line crossovers, and divergence signals may help users assess entry and exit timing more systematically. Beginners are encouraged to start with small amounts and gradually develop a trading system that suits their needs.


5. Triple Exponential Average FAQ


5.1 What is the Triple Exponential Average?


TRIX is an oscillator that applies exponential smoothing to price data three times and measures the rate of change of the triple-smoothed average. It is used to identify trend direction and potential reversal points.

5.2 How do you use the TRIX indicator?


Focus on three main signal types: TRIX crossing the zero line to identify trend direction; TRIX crossing its signal line to confirm potential buy or sell timing; and divergence between TRIX and price to warn of a potential trend reversal.

5.3 What is the difference between TRIX and the Triple Exponential Moving Average?


TRIX shows the percentage rate of change of a triple-smoothed average and oscillates around the zero line. The Triple Exponential Moving Average is plotted over the price chart and is used to track price trends. The two indicators use related calculation logic but serve different purposes.

5.4 How do you read a TRIX chart?


When TRIX is above the zero line and rising, bullish momentum is strengthening. When it is below the zero line and falling, bearish momentum is strengthening. Changes in the slope of the line can reflect the strength of the trend.

5.5 Is TRIX suitable for beginners?


Yes. TRIX uses clear and intuitive signal rules, but beginners should be aware of its lag and the risk of false signals in range-bound markets. It is recommended to confirm signals with other indicators on MEXC and apply appropriate risk management.

With its strong noise-filtering capabilities, TRIX is a practical tool for assessing trend and momentum. By understanding zero-line crossovers, signal-line crossovers, and divergence, and combining them with suitable parameter settings and risk controls, beginners can incorporate TRIX into their trading strategies more effectively.


Risk Warning: Technical indicators are based on historical data and do not guarantee future performance. Digital assets are highly volatile. Trade cautiously based on your risk tolerance and avoid blindly following market trends.

How to Use the Triple Exponential Average (TRIX) in Trading: A Complete Beginner's Guide

Content Overview

  • The Triple Exponential Average (TRIX) uses triple exponential smoothing to filter out market noise and help identify trend direction.
  • TRIX oscillates around the zero line. Positive values indicate bullish momentum, while negative values indicate bearish momentum.
  • Common TRIX trading signals include zero-line crossovers, signal-line crossovers, and divergence.
  • The indicator period can be adjusted to suit different trading styles, with shorter periods suited to short-term trading and longer periods suited to swing trading.
  • Users can add TRIX to the charting tools on MEXC and combine it with other analytical tools to support trading decisions.

1. What Is the Triple Exponential Average?


The Triple Exponential Average (TRIX), developed by Jack Hutson in the 1980s, is a widely used technical analysis indicator. It calculates the percentage rate of change of a triple-smoothed exponential moving average, filtering out short-term price fluctuations and insignificant noise to show the market's primary trend more clearly.

The indicator is based on three rounds of smoothing. First, an Exponential Moving Average is calculated using closing prices. The result is then smoothed a second and third time. This multilayered smoothing significantly reduces the impact of minor fluctuations, allowing traders to focus on more meaningful trend changes. Similar to the Moving Average Convergence Divergence, TRIX can help assess overbought and oversold conditions and generate potential buy and sell signals.


2. How to Use the Triple Exponential Average in Trading


2.1 Zero-line crossover signals


When the TRIX line crosses above the zero line, momentum shifts from negative to positive, which may indicate the beginning of an uptrend. Traders may consider looking for potential buying opportunities. When the TRIX line crosses below the zero line, momentum is weakening, and traders may consider reducing their positions or looking for potential selling opportunities.

2.2 Signal-line crossover signals


Traders often overlay a signal line on TRIX, typically a 9-period Exponential Moving Average of the indicator itself. A crossover above the signal line is generally considered bullish, while a crossover below it is considered bearish.

This method can be used in both trending and range-bound markets. In a range-bound market, it may help confirm support and resistance areas. In a trending market, it may help confirm that a pullback has ended and the primary trend is resuming.

2.3 Divergence signals


Divergence is an important tool for identifying potential trend reversals. When price forms a lower low while TRIX forms a higher low, a bullish divergence occurs, suggesting that bearish momentum may be fading and price could reverse upward. When price forms a higher high while TRIX forms a lower high, a bearish divergence occurs, suggesting that the uptrend may be weakening.

3. Advantages and Limitations of the TRIX Indicator


Advantages:

  • Triple smoothing effectively filters out noise and produces clearer signals.
  • Divergence can help provide early warning of potential trend reversals.
  • Flexible parameters can be adapted to different time frames and trading styles.

Limitations:

  • As a lagging indicator based on moving averages, TRIX may produce delayed signals during rapid market reversals.
  • It can generate false signals in range-bound markets.
  • Parameter selection involves a degree of subjectivity.

It is recommended to combine TRIX with other analytical methods, such as the Relative Strength Index, volume indicators, and support and resistance levels. Traders should also set strict stop-loss orders and manage position risk carefully.

4. How to Use TRIX on MEXC


MEXC offers comprehensive charting tools, allowing users to customize TRIX settings and combine it with other technical indicators.

Navigation: MEXC website → Spot/Futures → Indicators → TRIX

Whether trading Spot or Futures, combining zero-line crossovers, signal-line crossovers, and divergence signals may help users assess entry and exit timing more systematically. Beginners are encouraged to start with small amounts and gradually develop a trading system that suits their needs.


5. Triple Exponential Average FAQ


5.1 What is the Triple Exponential Average?


TRIX is an oscillator that applies exponential smoothing to price data three times and measures the rate of change of the triple-smoothed average. It is used to identify trend direction and potential reversal points.

5.2 How do you use the TRIX indicator?


Focus on three main signal types: TRIX crossing the zero line to identify trend direction; TRIX crossing its signal line to confirm potential buy or sell timing; and divergence between TRIX and price to warn of a potential trend reversal.

5.3 What is the difference between TRIX and the Triple Exponential Moving Average?


TRIX shows the percentage rate of change of a triple-smoothed average and oscillates around the zero line. The Triple Exponential Moving Average is plotted over the price chart and is used to track price trends. The two indicators use related calculation logic but serve different purposes.

5.4 How do you read a TRIX chart?


When TRIX is above the zero line and rising, bullish momentum is strengthening. When it is below the zero line and falling, bearish momentum is strengthening. Changes in the slope of the line can reflect the strength of the trend.

5.5 Is TRIX suitable for beginners?


Yes. TRIX uses clear and intuitive signal rules, but beginners should be aware of its lag and the risk of false signals in range-bound markets. It is recommended to confirm signals with other indicators on MEXC and apply appropriate risk management.

With its strong noise-filtering capabilities, TRIX is a practical tool for assessing trend and momentum. By understanding zero-line crossovers, signal-line crossovers, and divergence, and combining them with suitable parameter settings and risk controls, beginners can incorporate TRIX into their trading strategies more effectively.


Risk Warning: Technical indicators are based on historical data and do not guarantee future performance. Digital assets are highly volatile. Trade cautiously based on your risk tolerance and avoid blindly following market trends.