क्रिप्टो खरीदें
मार्केट
स्पॉट
फ़्यूचर्सANT
कमाएँ
इवेंट सेंटर
रिवॉर्ड हब
अधिक
100%+ PoR
How to Use Volume Standard Deviation (VSTD) in Stocks Trading: A Beginner's GuideHow to Use Volume Standard Deviation (VSTD) in Stocks Trading: A Beginner's Guide
कैंसिल करें

How to Use Volume Standard Deviation (VSTD) in Stocks Trading: A Beginner's Guide

Key Takeaways:

  • Volume Standard Deviation (VSTD) is a statistical technical indicator that measures fluctuations in trading volume over a specified period.
  • VSTD is highly sensitive to unusual increases and decreases in volume and is an important tool for assessing potential price tops.
  • VSTD should be used alongside price action, support and resistance levels, and other information. Using it alone can lead to misinterpretation.
  • MEXC Stocks supports VSTD, allowing you to add the indicator directly to your chart for analysis.

1. What Is Volume Standard Deviation?


Volume Standard Deviation (VSTD) is a technical indicator that applies the statistical concept of standard deviation to measure fluctuations in trading volume over a specified period.

Standard deviation describes how far a set of values deviates from its average. The greater the fluctuations, the higher the standard deviation. Applied to trading volume, VSTD provides a visual measure of recent volume fluctuations. VSTD rises when trading volume becomes more variable and falls when volume becomes more consistent.

2. How to Use VSTD in Stocks Trading


2.1 Tracking volume expansion and contraction


VSTD can help track trends in volume expansion and contraction. When a stock trades within a range, a noticeable rise in VSTD typically signals an unusual increase in volume. This often reflects active capital flows into and out of the stock and can be an important indication that a price move may be approaching.

2.2 Assessing price tops and price-volume divergence


If a stock reaches a new price high without a corresponding rise in VSTD, the move may lack volume support. Investors should remain cautious, as the price could pull back. Conversely, when VSTD rises rapidly to an unusually high historical level, it indicates excessive volume expansion and overheated market sentiment. If the price then stalls or begins to decline, this is often interpreted as a short-term sell signal.

2.3 Confirming breakouts


Increased volume often accompanies a price breakout above key resistance. If VSTD also breaks above its previous range and reaches a new high during an upward price breakout, it indicates that the move has genuine volume support, lending credibility to the breakout. If the price breaks out while VSTD remains low, traders should be alert to the risk of a false breakout.

2.4 Assessing trend sustainability


During a steady uptrend, low-to-moderate VSTD readings suggest that the move is progressing in an orderly manner. A sudden spike in VSTD typically signals a change in market dynamics: The trend may be accelerating, or it may be nearing its end. Price patterns should be considered alongside the indicator to assess the situation.

3. Considerations When Using VSTD in Stocks Trading


1) Stocks vary considerably in their free float and trading activity, so there is no universal threshold for an extremely high VSTD reading. Actively traded large-cap stocks have substantially higher thresholds than thinly traded small-cap stocks. To use the indicator effectively, track each stock's historical VSTD range and compare current readings with its own past levels.

2) Algorithmic trading accounts for a significant share of stock market activity. Short-term price and volume anomalies may result from high-frequency trading, making VSTD alone prone to misinterpretation. Combine it with candlestick patterns, support and resistance levels, trendlines, and turnover ratios rather than basing trading decisions solely on volume fluctuations.

3) Stocks are not subject to daily price limits, and price-volume movements are more influenced by fundamentals and macro-level capital flows. When using VSTD, also consider macroeconomic data and monetary policy to improve the reliability of your analysis.

4. How to Use VSTD on MEXC


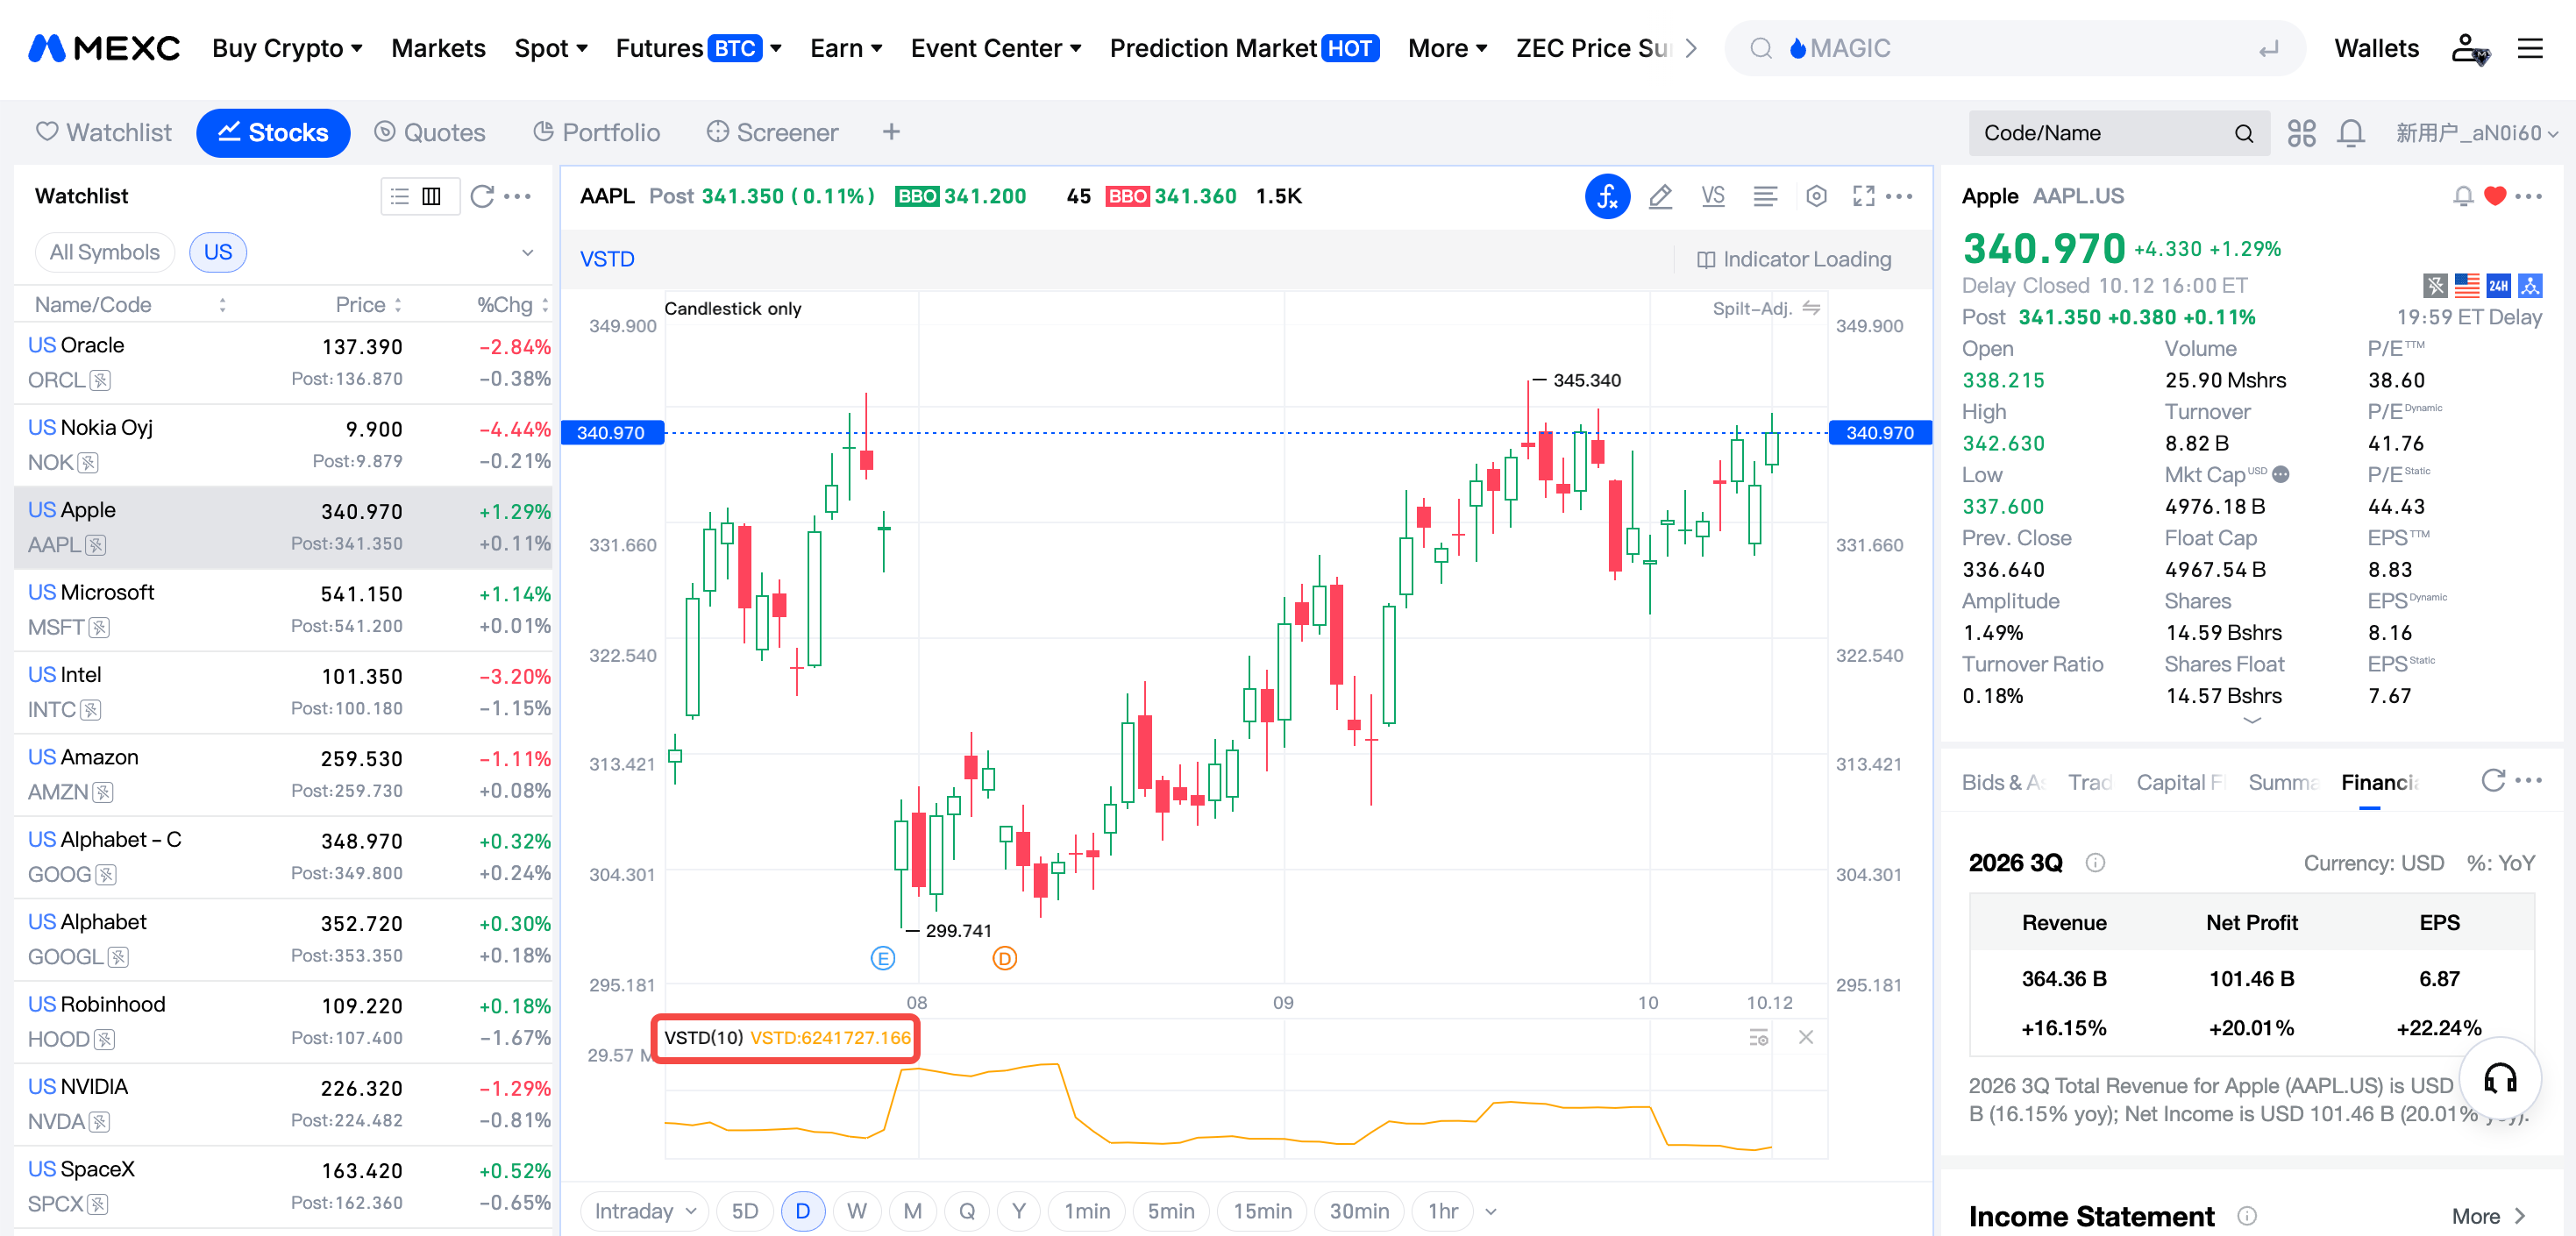
MEXC Stocks supports VSTD. You can add it directly to the trading chart and customize its lookback period, which is generally set to 10 by default. Short-term traders can use a shorter period to increase sensitivity, while medium- and long-term investors can use a longer period to filter out short-term noise.

Combined with MEXC's multiple chart time frames, drawing tools, and other volume indicators, VSTD can help you analyze price-volume relationships more comprehensively, identify volume-backed breakouts, and avoid risks associated with overheated price tops.


5. Volume Standard Deviation FAQ


5.1 What is Volume Standard Deviation?


Volume Standard Deviation measures how dispersed trading volume is over the past N periods, indicating the extent of volume fluctuations. It helps identify unusual fluctuations in trading volume and provides additional context when assessing potential reversals or breakouts.

5.2 How is standard deviation used in trading?


Standard deviation can be used to assess volatility, identify unusual market activity, and confirm breakouts. When trading volume exceeds its average by more than two standard deviations, it indicates unusually high volume, which may suggest institutional participation or an approaching price move.

5.3 Are volume volatility and standard deviation the same thing?


They are closely related. Standard deviation is a common statistical measure of volatility. VSTD essentially quantifies volume volatility: Higher readings indicate larger fluctuations in trading volume.

5.4 How high does VSTD need to be to signal unusual activity?


There is no universal threshold. Stocks with a large free float and active trading have higher thresholds for extreme readings, while thinly traded stocks have lower thresholds. Assess each stock relative to its own historical range.

5.5 What is the difference between trading volume and trading value?


Trading volume is the number of shares or contracts traded, while trading value is the total monetary value of those trades (quantity × price). VSTD is generally calculated using trading volume, and trading value can be used alongside it to cross-check the analysis.

How to Use Volume Standard Deviation (VSTD) in Stocks Trading: A Beginner's Guide

Key Takeaways:

  • Volume Standard Deviation (VSTD) is a statistical technical indicator that measures fluctuations in trading volume over a specified period.
  • VSTD is highly sensitive to unusual increases and decreases in volume and is an important tool for assessing potential price tops.
  • VSTD should be used alongside price action, support and resistance levels, and other information. Using it alone can lead to misinterpretation.
  • MEXC Stocks supports VSTD, allowing you to add the indicator directly to your chart for analysis.

1. What Is Volume Standard Deviation?


Volume Standard Deviation (VSTD) is a technical indicator that applies the statistical concept of standard deviation to measure fluctuations in trading volume over a specified period.

Standard deviation describes how far a set of values deviates from its average. The greater the fluctuations, the higher the standard deviation. Applied to trading volume, VSTD provides a visual measure of recent volume fluctuations. VSTD rises when trading volume becomes more variable and falls when volume becomes more consistent.

2. How to Use VSTD in Stocks Trading


2.1 Tracking volume expansion and contraction


VSTD can help track trends in volume expansion and contraction. When a stock trades within a range, a noticeable rise in VSTD typically signals an unusual increase in volume. This often reflects active capital flows into and out of the stock and can be an important indication that a price move may be approaching.

2.2 Assessing price tops and price-volume divergence


If a stock reaches a new price high without a corresponding rise in VSTD, the move may lack volume support. Investors should remain cautious, as the price could pull back. Conversely, when VSTD rises rapidly to an unusually high historical level, it indicates excessive volume expansion and overheated market sentiment. If the price then stalls or begins to decline, this is often interpreted as a short-term sell signal.

2.3 Confirming breakouts


Increased volume often accompanies a price breakout above key resistance. If VSTD also breaks above its previous range and reaches a new high during an upward price breakout, it indicates that the move has genuine volume support, lending credibility to the breakout. If the price breaks out while VSTD remains low, traders should be alert to the risk of a false breakout.

2.4 Assessing trend sustainability


During a steady uptrend, low-to-moderate VSTD readings suggest that the move is progressing in an orderly manner. A sudden spike in VSTD typically signals a change in market dynamics: The trend may be accelerating, or it may be nearing its end. Price patterns should be considered alongside the indicator to assess the situation.


3. Considerations When Using VSTD in Stocks Trading


1) Stocks vary considerably in their free float and trading activity, so there is no universal threshold for an extremely high VSTD reading. Actively traded large-cap stocks have substantially higher thresholds than thinly traded small-cap stocks. To use the indicator effectively, track each stock's historical VSTD range and compare current readings with its own past levels.

2) Algorithmic trading accounts for a significant share of stock market activity. Short-term price and volume anomalies may result from high-frequency trading, making VSTD alone prone to misinterpretation. Combine it with candlestick patterns, support and resistance levels, trendlines, and turnover ratios rather than basing trading decisions solely on volume fluctuations.

3) Stocks are not subject to daily price limits, and price-volume movements are more influenced by fundamentals and macro-level capital flows. When using VSTD, also consider macroeconomic data and monetary policy to improve the reliability of your analysis.

4. How to Use VSTD on MEXC


MEXC Stocks supports VSTD. You can add it directly to the trading chart and customize its lookback period, which is generally set to 10 by default. Short-term traders can use a shorter period to increase sensitivity, while medium- and long-term investors can use a longer period to filter out short-term noise.

Combined with MEXC's multiple chart time frames, drawing tools, and other volume indicators, VSTD can help you analyze price-volume relationships more comprehensively, identify volume-backed breakouts, and avoid risks associated with overheated price tops.


5. Volume Standard Deviation FAQ


5.1 What is Volume Standard Deviation?


Volume Standard Deviation measures how dispersed trading volume is over the past N periods, indicating the extent of volume fluctuations. It helps identify unusual fluctuations in trading volume and provides additional context when assessing potential reversals or breakouts.

5.2 How is standard deviation used in trading?


Standard deviation can be used to assess volatility, identify unusual market activity, and confirm breakouts. When trading volume exceeds its average by more than two standard deviations, it indicates unusually high volume, which may suggest institutional participation or an approaching price move.

5.3 Are volume volatility and standard deviation the same thing?


They are closely related. Standard deviation is a common statistical measure of volatility. VSTD essentially quantifies volume volatility: Higher readings indicate larger fluctuations in trading volume.

5.4 How high does VSTD need to be to signal unusual activity?


There is no universal threshold. Stocks with a large free float and active trading have higher thresholds for extreme readings, while thinly traded stocks have lower thresholds. Assess each stock relative to its own historical range.

5.5 What is the difference between trading volume and trading value?


Trading volume is the number of shares or contracts traded, while trading value is the total monetary value of those trades (quantity × price). VSTD is generally calculated using trading volume, and trading value can be used alongside it to cross-check the analysis.