क्रिप्टो खरीदें
मार्केट
स्पॉट
फ़्यूचर्सBTC
कमाएँ
इवेंट सेंटर
रिवॉर्ड हब
अधिक
What Is a Hammer Candlestick? A Beginner's Guide to Identifying and Trading the PatternWhat Is a Hammer Candlestick? A Beginner's Guide to Identifying and Trading the Pattern
कैटेगरी की लिस्ट
कैंसिल करें

What Is a Hammer Candlestick? A Beginner's Guide to Identifying and Trading the Pattern

Key Takeaways:

  • A hammer is a candlestick pattern that may signal a bullish reversal after a downtrend. Its lower shadow is at least twice the length of its body.
  • A hammer's color, whether red or green, does not change its core interpretation. Its shape and position within the trend matter more.
  • A hammer requires confirmation from subsequent price action and should not be used as the sole basis for a trade.
  • Related patterns, such as the inverted hammer and hanging man, require different interpretations. The preceding trend helps distinguish them.
  • MEXC provides candlestick charts and technical analysis tools that help users identify hammer patterns and assess potential market signals.

1. What Is a Hammer Candlestick?


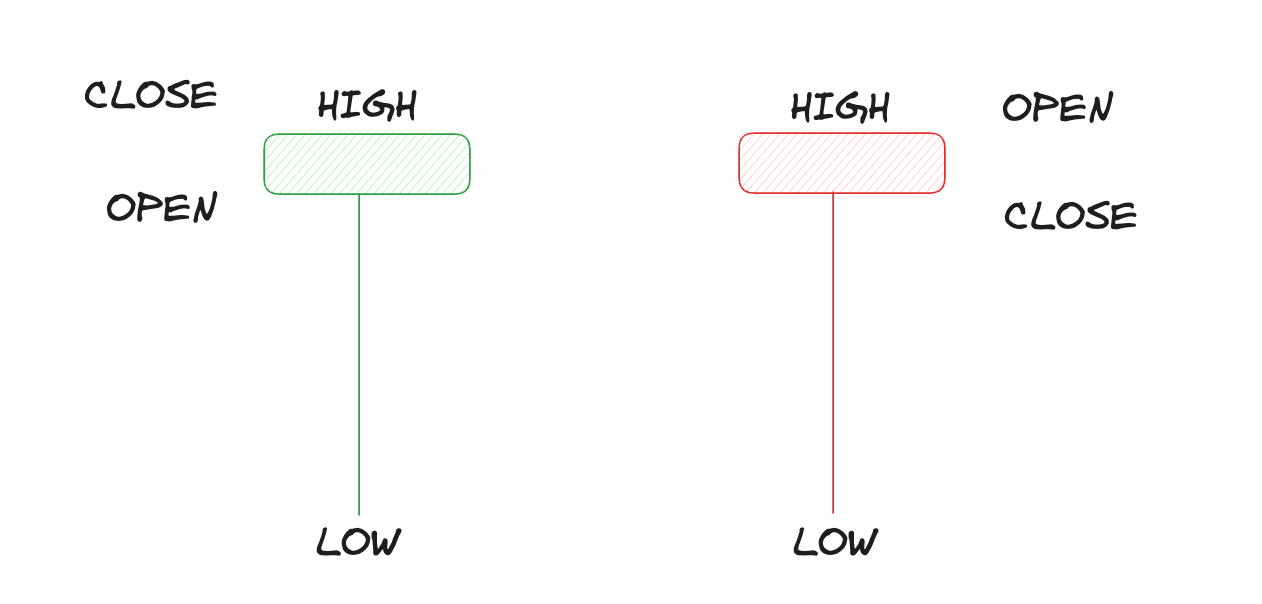
A hammer is a widely recognized potential bullish reversal pattern on a candlestick chart. It forms when an asset's price falls sharply during a trading period, then recovers to close near its opening price. The resulting candle resembles a hammer: a small body near the top of the trading range, a long lower shadow, and little or no upper shadow.

A standard hammer has a lower shadow at least twice the length of its body. The body sits near the top of the candle's price range, with a very short upper shadow or none at all, giving it a roughly T-shaped appearance.

The candle's body represents the range between the opening and closing prices, while its shadows show the period's high and low. A hammer's long lower shadow suggests that sellers initially pushed prices sharply lower, but buyers stepped in and drove prices back toward the top of the range. This recovery from the low may indicate that the market is approaching a potential bottom.

2. What Does a Hammer Pattern Indicate?


2.1 The balance between buyers and sellers


A hammer reflects a shift in the balance between buyers and sellers. During a downtrend, sellers initially remain in control and push prices much lower. Buyers then absorb the selling pressure and lift the price back toward the opening level by the close, leaving a long lower shadow. This may suggest that selling pressure is weakening and buyers are beginning to regain control, creating the possibility of an upward reversal.

2.2 Why the preceding trend matters


A hammer is read as a potential bullish reversal only when it follows a clear downtrend. If a candle with the same shape appears after an uptrend, it is called a hanging man and may instead signal a bearish reversal. Always assess the preceding price trend before identifying a hammer.

2.3 Why confirmation is essential


A hammer signals only a possible reversal; it does not confirm that the trend has changed. A subsequent candle that closes above the hammer's high can provide stronger bullish confirmation. Ideally, this confirmation candle is accompanied by higher trading volume, suggesting stronger buying interest. Traders may consider a long position once confirmation develops or afterward.


3.1 Green hammer


A green hammer forms when the closing price is above the opening price. The price not only recovers from its low but also closes above the open, which is generally interpreted as a stronger bullish indication.

3.2 Red hammer


A red hammer forms when the closing price is below the opening price. Although the close is slightly below the open, the candle still shows rejection of lower prices. Both red and green candles can qualify as hammer patterns. The candle's shape and the preceding trend are more important than its color.

3.3 Inverted hammer


An inverted hammer is the upside-down version of a hammer. It has a small body near the bottom of the trading range, a long upper shadow, and little or no lower shadow. It also forms after a downtrend and may suggest a bullish reversal. Buyers attempt to push prices higher but could not sustain the gains, leaving the close near the open. The buying attempt may indicate weakening bearish pressure, although it requires confirmation.

3.4 Hanging man


A hanging man has the same shape as a hammer, but it appears in a different trend context. It forms after an uptrend and is a potential bearish reversal signal. Confusing the two is a common mistake in candlestick analysis.


4. Trading Strategies Using Hammer Patterns


4.1 Entry approaches


Conservative approach: Wait for a confirmation candle that closes above the hammer's close before considering a long position. This can help filter out market noise, but it may mean entering at a higher price.

Aggressive approach: Enter when the hammer closes, without waiting for confirmation. This may offer a lower entry price but carries a greater risk of acting on market noise rather than a sustained reversal.

4.2 Stop-loss placement


A stop-loss order may be placed below the hammer's low. If the preceding candle has a lower low, placing the stop below that level can allow more room for price fluctuations, but also increases the potential loss for the same position size.

4.3 Combining the pattern with other tools


A hammer can be more informative when assessed alongside other technical analysis tools. A hammer near a support level may strengthen a bullish setup, while an oversold Relative Strength Index (RSI) reading may provide additional context. A hammer near a key moving average, such as the 50-day or 200-day average, or a Fibonacci retracement level may also support the possibility of a reversal. Higher trading volume can provide further evidence of buying interest.

When trading on MEXC, users can use candlestick charts to identify hammer patterns and assess them alongside moving averages, the Relative Strength Index (RSI), and other tools. Combining these perspectives can support more informed trading decisions.

5. Limitations of Hammer Patterns


Although a hammer can provide a useful reference for a potential reversal, traders should understand its limitations:

1) A reversal is not guaranteed. Prices may continue to fall even after a confirmation candle appears. Market noise can still produce misleading setups.

2) The stop-loss distance may be too large. A hammer with a long lower shadow followed by a strong confirmation candle can leave a substantial gap between the entry price and stop-loss level, making the risk-to-reward ratio less favorable.

3) The pattern does not provide a price target. Traders need other patterns or analysis methods to assess potential exit points.

4) The timeframe affects interpretation. Daily and weekly hammer patterns are generally considered more meaningful than those on minute charts.

Use hammer patterns as part of a broader trading approach that includes trend analysis, risk management, and position sizing. Avoid making major trading decisions based on a single candle alone.

6. Hammer Candlestick FAQ


6.1 Is a hammer bullish or bearish?


A hammer is a potential bullish reversal signal that forms after a downtrend. It suggests that selling pressure may be weakening and prices could reverse upward. Confirmation from subsequent price action is still needed.

6.2 Is a red hammer still bullish?


Yes. Although a red hammer closes below its opening price, it still shows a strong recovery from the low and can be interpreted as a potential bullish signal. It is generally considered a slightly weaker bullish indication than a green hammer.

6.3 What is the difference between a green and a red hammer?


A green hammer closes above its opening price and is generally interpreted as more bullish. A red hammer closes below its opening price and may provide a slightly weaker bullish indication. Both can qualify as hammer patterns; their shape and trend context matter more than color.

6.4 What does an inverted hammer mean?


An inverted hammer has a small body near the bottom of its range and a long upper shadow. It forms after a downtrend and may suggest weakening bearish pressure and a possible bullish reversal. It also requires confirmation from subsequent candles.

6.5 How does a hammer differ from a hanging man?


They have the same shape but appear in different contexts. A hammer follows a downtrend and is potentially bullish. A hanging man follows an uptrend and is potentially bearish.

6.6 What does a hammer-shaped candle in an uptrend mean?


A hammer-shaped candle after an uptrend is called a hanging man. It may suggest weakening upward momentum and serves as a potential bearish warning rather than a buying signal.

6.7 How can a hammer signal be confirmed?


Examine the candlestick that forms after the hammer. A close above the hammer's closing price, accompanied by higher volume, can provide bullish confirmation. Support levels and an oversold RSI reading can offer additional context.

6.8 What is the strongest candlestick reversal pattern?


No single pattern is universally the strongest. Hammers, bullish engulfing patterns, and morning stars are all common bullish reversal patterns. Their reliability depends on the preceding trend, supporting volume, and agreement among other technical signals.

What Is a Hammer Candlestick? A Beginner's Guide to Identifying and Trading the Pattern

Key Takeaways:

  • A hammer is a candlestick pattern that may signal a bullish reversal after a downtrend. Its lower shadow is at least twice the length of its body.
  • A hammer's color, whether red or green, does not change its core interpretation. Its shape and position within the trend matter more.
  • A hammer requires confirmation from subsequent price action and should not be used as the sole basis for a trade.
  • Related patterns, such as the inverted hammer and hanging man, require different interpretations. The preceding trend helps distinguish them.
  • MEXC provides candlestick charts and technical analysis tools that help users identify hammer patterns and assess potential market signals.

1. What Is a Hammer Candlestick?


A hammer is a widely recognized potential bullish reversal pattern on a candlestick chart. It forms when an asset's price falls sharply during a trading period, then recovers to close near its opening price. The resulting candle resembles a hammer: a small body near the top of the trading range, a long lower shadow, and little or no upper shadow.

A standard hammer has a lower shadow at least twice the length of its body. The body sits near the top of the candle's price range, with a very short upper shadow or none at all, giving it a roughly T-shaped appearance.

The candle's body represents the range between the opening and closing prices, while its shadows show the period's high and low. A hammer's long lower shadow suggests that sellers initially pushed prices sharply lower, but buyers stepped in and drove prices back toward the top of the range. This recovery from the low may indicate that the market is approaching a potential bottom.


2. What Does a Hammer Pattern Indicate?


2.1 The balance between buyers and sellers


A hammer reflects a shift in the balance between buyers and sellers. During a downtrend, sellers initially remain in control and push prices much lower. Buyers then absorb the selling pressure and lift the price back toward the opening level by the close, leaving a long lower shadow. This may suggest that selling pressure is weakening and buyers are beginning to regain control, creating the possibility of an upward reversal.

2.2 Why the preceding trend matters


A hammer is read as a potential bullish reversal only when it follows a clear downtrend. If a candle with the same shape appears after an uptrend, it is called a hanging man and may instead signal a bearish reversal. Always assess the preceding price trend before identifying a hammer.

2.3 Why confirmation is essential


A hammer signals only a possible reversal; it does not confirm that the trend has changed. A subsequent candle that closes above the hammer's high can provide stronger bullish confirmation. Ideally, this confirmation candle is accompanied by higher trading volume, suggesting stronger buying interest. Traders may consider a long position once confirmation develops or afterward.


3.1 Green hammer


A green hammer forms when the closing price is above the opening price. The price not only recovers from its low but also closes above the open, which is generally interpreted as a stronger bullish indication.

3.2 Red hammer


A red hammer forms when the closing price is below the opening price. Although the close is slightly below the open, the candle still shows rejection of lower prices. Both red and green candles can qualify as hammer patterns. The candle's shape and the preceding trend are more important than its color.

3.3 Inverted hammer


An inverted hammer is the upside-down version of a hammer. It has a small body near the bottom of the trading range, a long upper shadow, and little or no lower shadow. It also forms after a downtrend and may suggest a bullish reversal. Buyers attempt to push prices higher but could not sustain the gains, leaving the close near the open. The buying attempt may indicate weakening bearish pressure, although it requires confirmation.

3.4 Hanging man


A hanging man has the same shape as a hammer, but it appears in a different trend context. It forms after an uptrend and is a potential bearish reversal signal. Confusing the two is a common mistake in candlestick analysis.


4. Trading Strategies Using Hammer Patterns


4.1 Entry approaches


Conservative approach: Wait for a confirmation candle that closes above the hammer's close before considering a long position. This can help filter out market noise, but it may mean entering at a higher price.

Aggressive approach: Enter when the hammer closes, without waiting for confirmation. This may offer a lower entry price but carries a greater risk of acting on market noise rather than a sustained reversal.

4.2 Stop-loss placement


A stop-loss order may be placed below the hammer's low. If the preceding candle has a lower low, placing the stop below that level can allow more room for price fluctuations, but also increases the potential loss for the same position size.

4.3 Combining the pattern with other tools


A hammer can be more informative when assessed alongside other technical analysis tools. A hammer near a support level may strengthen a bullish setup, while an oversold Relative Strength Index (RSI) reading may provide additional context. A hammer near a key moving average, such as the 50-day or 200-day average, or a Fibonacci retracement level may also support the possibility of a reversal. Higher trading volume can provide further evidence of buying interest.

When trading on MEXC, users can use candlestick charts to identify hammer patterns and assess them alongside moving averages, the Relative Strength Index (RSI), and other tools. Combining these perspectives can support more informed trading decisions.

5. Limitations of Hammer Patterns


Although a hammer can provide a useful reference for a potential reversal, traders should understand its limitations:

1) A reversal is not guaranteed. Prices may continue to fall even after a confirmation candle appears. Market noise can still produce misleading setups.

2) The stop-loss distance may be too large. A hammer with a long lower shadow followed by a strong confirmation candle can leave a substantial gap between the entry price and stop-loss level, making the risk-to-reward ratio less favorable.

3) The pattern does not provide a price target. Traders need other patterns or analysis methods to assess potential exit points.

4) The timeframe affects interpretation. Daily and weekly hammer patterns are generally considered more meaningful than those on minute charts.

Use hammer patterns as part of a broader trading approach that includes trend analysis, risk management, and position sizing. Avoid making major trading decisions based on a single candle alone.

6. Hammer Candlestick FAQ


6.1 Is a hammer bullish or bearish?


A hammer is a potential bullish reversal signal that forms after a downtrend. It suggests that selling pressure may be weakening and prices could reverse upward. Confirmation from subsequent price action is still needed.

6.2 Is a red hammer still bullish?


Yes. Although a red hammer closes below its opening price, it still shows a strong recovery from the low and can be interpreted as a potential bullish signal. It is generally considered a slightly weaker bullish indication than a green hammer.

6.3 What is the difference between a green and a red hammer?


A green hammer closes above its opening price and is generally interpreted as more bullish. A red hammer closes below its opening price and may provide a slightly weaker bullish indication. Both can qualify as hammer patterns; their shape and trend context matter more than color.

6.4 What does an inverted hammer mean?


An inverted hammer has a small body near the bottom of its range and a long upper shadow. It forms after a downtrend and may suggest weakening bearish pressure and a possible bullish reversal. It also requires confirmation from subsequent candles.

6.5 How does a hammer differ from a hanging man?


They have the same shape but appear in different contexts. A hammer follows a downtrend and is potentially bullish. A hanging man follows an uptrend and is potentially bearish.

6.6 What does a hammer-shaped candle in an uptrend mean?


A hammer-shaped candle after an uptrend is called a hanging man. It may suggest weakening upward momentum and serves as a potential bearish warning rather than a buying signal.

6.7 How can a hammer signal be confirmed?


Examine the candlestick that forms after the hammer. A close above the hammer's closing price, accompanied by higher volume, can provide bullish confirmation. Support levels and an oversold RSI reading can offer additional context.

6.8 What is the strongest candlestick reversal pattern?


No single pattern is universally the strongest. Hammers, bullish engulfing patterns, and morning stars are all common bullish reversal patterns. Their reliability depends on the preceding trend, supporting volume, and agreement among other technical signals.