

How To Query K-Line Data for a Specific Date Quickly
How To Query K-Line Data for a Specific Date Quickly
1. Querying K-line Data for a Specific Date
2. Querying Custom Range K-line Data
Popular Articles
View More
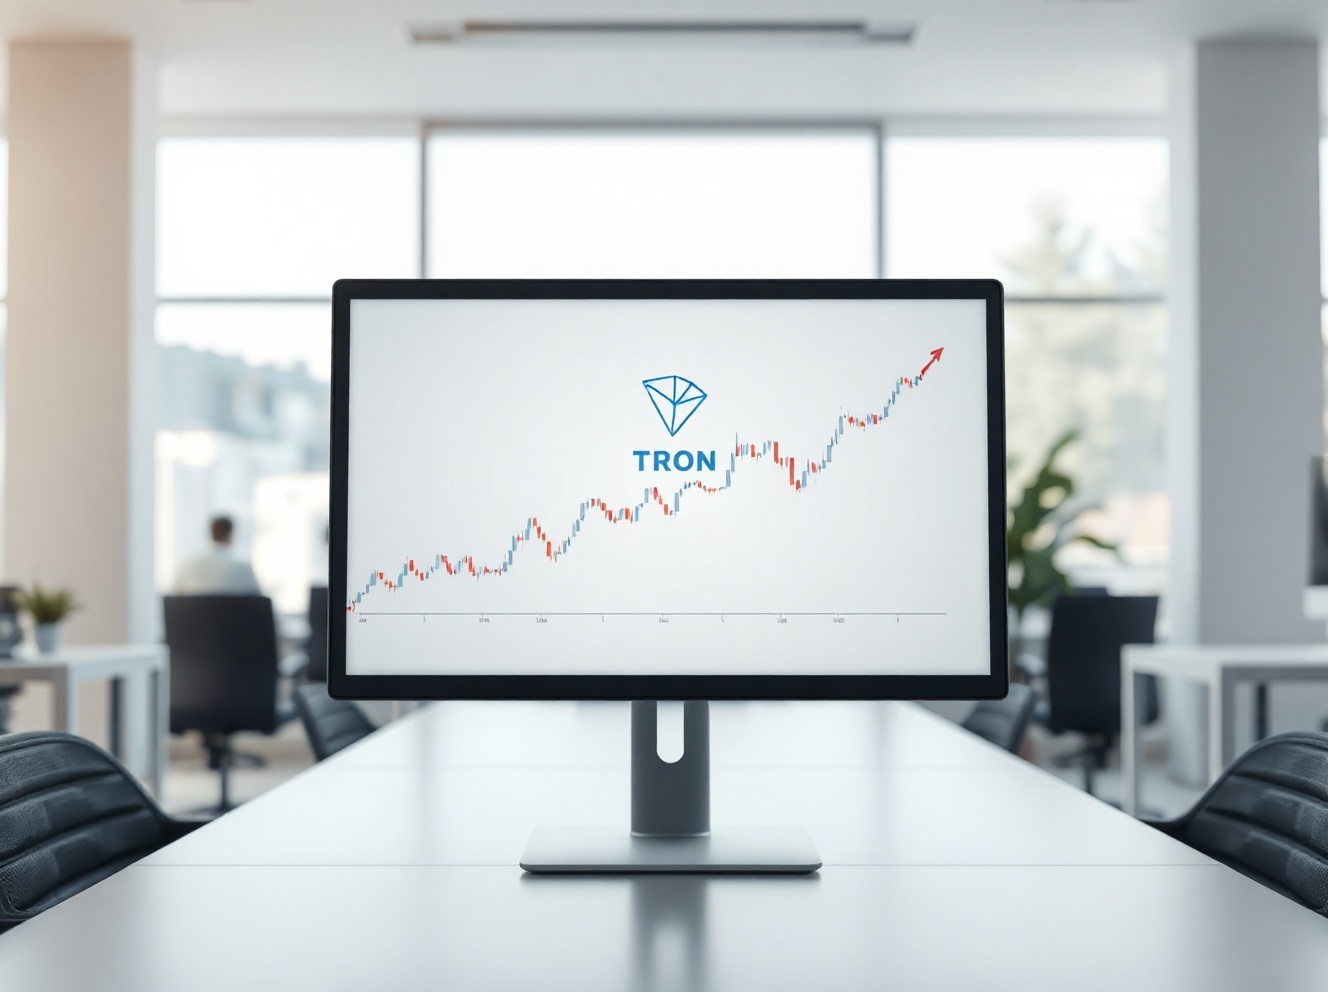
TRON (TRX) Price Prediction July 2026: Will TRX Finally Break Its Three-Week Trading Range?
TRX has spent the last three weeks doing something that looks boring on a chart but actually matters. It has held a tight range. TRON's token has stayed locked between roughly $0.31 and $0.33 for

Can You Buy and Sell Pi Coin? Pi Network Trading Explained
Pi Coin is one of the most searched crypto names because it sits in an awkward place: millions of people know the app, but many still do not know what is actually tradable. That is the real story.

What Is Bitcoin Magazine? History, Pro Charts, and How to Follow It
If you've spent any time searching for Bitcoin news, you've almost certainly come across Bitcoin Magazine. It's the oldest publication dedicated exclusively to Bitcoin — launched before most people

Hot Crypto Updates
View More
CASHCAT Becomes Robinhood Chain First Breakout Meme Coin to Top 100 Million Market Cap
Overview Robinhood spent a year paving the way for its own blockchain, pitching tokenized US stocks as the serious narrative, yet the first asset to truly break out on the new chain is a cartoon cat

Tesla Pi Phone: Groundbreaking Tech or the Internet's Biggest Hoax?
Is the Tesla Pi Phone 2026 real? We cut through the hype to examine the Starlink connectivity, Neuralink BCI, and solar charging rumors — and what Elon Musk actually said. Key Takeaways As of April

Pi Network Price Prediction 2026: Can This Mobile Mining Pioneer Reclaim Its Glory?
Pi Network (PI) 2026 Price Prediction: Expert analysis reveals $0.188 current price with forecasts ranging $0.20-$3.50. Discover key price drivers, technical analysis, market outlook, and why MEXC

Trending News
View More
TRON smashes 392 million address mark! What do the fresh inflows and price levels reveal?
🚀$TRX wallet addresses just surpassed 392 million. 📈TRON’s TVL jumped by $1.95 billion since July 1, up 7.8% in weeks. 💼Institutional buys and regulatory shifts

TRON Price Prediction 2028: Can TRX Reach $1?
TRX has spent the last couple of years grinding higher after years of going nowhere, and the monthly chart is now sitting inside a structure that traders can't
Related Articles
View More
How to Use MEXC's Account Data Export Function
To help users quickly export their personal trading and funding history, MEXC has launched a self-service account data export function, allowing users to easily export data from the past 3 years.1. Ke
What Is MEXC Earn?
1. What is MEXC Earn?MEXC Earn is a one-stop product launched by MEXC to help users discover a variety of token-holding earning opportunities. It covers flexible savings, fixed savings, and on-chain e

How to Deposit Crypto to MEXC App: MetaMask & Wallet Transfer Guide
If you have crypto in other wallets or platforms, you can choose to transfer them to the MEXC platform for trading.How to Deposit Crypto to the MEXC PlatformStep 1: Open the MEXC App on your mobile ph


