GRASS (GRASS) Price Prediction 2026–2030: Can GRASS Hit $0.30 Soon?
- GRASS has printed a sharp bullish breakout candle on the daily timeframe, surging toward $0.28 before pulling back slightly.
- RSI is holding above 60, signaling strengthening momentum without extreme overbought conditions.
- A sustained move above $0.28–$0.30 could confirm a broader bullish structure shift.
GRASS (GRASS) has delivered a strong upside reaction on the 1D chart against the U.S. Dollar on Kraken, rallying from the $0.18 region to a recent high near $0.29. The latest daily candle pushed aggressively toward $0.28 before closing near $0.2625, reflecting a minor intraday pullback after strong buying pressure. At the time of analysis, GRASS trades around $0.262. The rebound follows a multi-week correction that found support near $0.15, where buyers stepped in decisively, forming a higher low structure and reigniting short-term bullish momentum.
Market Sentiment and Momentum
Short-term sentiment has shifted bullish following the sharp expansion move. After trending downward through early February and compressing near the lower Bollinger Band around $0.15, GRASS staged a recovery that accelerated as price reclaimed the 20-day SMA near $0.20. The recent breakout candle reflects renewed accumulation pressure.
However, the $0.28–$0.30 region remains a key resistance cluster. A strong daily close above $0.30 would confirm continuation and open the path toward prior structural highs. Failure to sustain above $0.26 could trigger consolidation between $0.20 and $0.28.
Also Read: Bitcoin Price Prediction 2026–2030: Can BTC Break Above $100,000 Soon?
Current Market Overview
The Bollinger Bands (20 SMA, 2 standard deviations) are expanding, indicating rising volatility following the breakout. The mid-band sits near $0.203, while the lower band remains around $0.150. Price trading firmly above the mid-band confirms short-term bullish acceleration.
The RSI (14) currently reads approximately 61.5, holding comfortably above the 50 midline. This signals strengthening momentum without reaching extreme overbought territory. A push toward 70 alongside a breakout above $0.30 would increase the probability of continuation. A drop below 50 would indicate weakening momentum. Immediate support stands near $0.20, followed by stronger structural support at $0.15. Immediate resistance lies at $0.28–$0.30. A confirmed breakout above $0.30 would expose $0.35 and potentially $0.40.
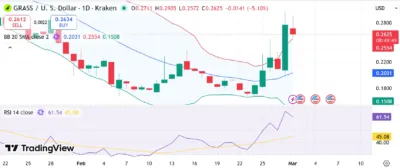
Source: Tradingview
GRASS Price Forecast (2026–2030)
| Year | Minimum Price | Average Price | Maximum Price | Potential ROI (From $0.262) |
|---|---|---|---|---|
| 2026 | $0.18 | $0.30 | $0.45 | +71% |
| 2027 | $0.25 | $0.50 | $0.75 | +186% |
| 2028 | $0.40 | $0.80 | $1.20 | +358% |
| 2029 | $0.60 | $1.30 | $1.90 | +625% |
| 2030 | $0.90 | $2.00 | $2.80 | +969% |
2026
In 2026, GRASS may remain volatile while attempting to solidify support above $0.20. A successful breakout above $0.30 could allow price to test $0.40–$0.45 during strong bullish phases.
2027
If higher highs and higher lows continue forming, GRASS could approach $0.75 as broader market participation strengthens.
2028
Sustained expansion cycles could push GRASS toward the $1.20 region under favorable liquidity conditions.
2029
Consolidation above $1.00 may support rallies toward $1.90 if adoption and trading volume expand.
2030
Long-term structural growth and continued speculative cycles could position GRASS near $2.50–$2.80 under strong market conditions.
Conclusion
GRASS enters early March with renewed bullish momentum after rebounding sharply from the $0.15 demand zone. RSI strength above 60 confirms improving momentum, while expanding Bollinger Bands highlight rising volatility. The $0.28–$0.30 resistance zone remains decisive. A confirmed breakout above this region would significantly strengthen the long-term outlook and increase the probability of sustained upside toward $0.40 and beyond.
FAQs
1. What is the current market sentiment for GRASS?
Short-term sentiment has turned bullish after a strong breakout from the $0.15 support zone, with RSI holding above 60 and price trading above the 20-day SMA.
2. Is GRASS currently overbought?
No. The RSI remains below the 70 overbought threshold, indicating strengthening momentum without extreme exhaustion signals.
3. What are the key resistance levels for GRASS?
The immediate resistance zone sits between $0.28 and $0.30. A confirmed breakout above $0.30 could open the path toward $0.35 and potentially $0.40.
4. Where are the major support levels?
Immediate support stands near $0.20, aligned with the 20-day SMA. Stronger structural support remains near $0.15, where the recent rebound originated.
5. Can GRASS reach $1.00 in the long term?
Based on projected growth scenarios between 2028 and 2029, GRASS could approach or exceed $1.00 if higher highs continue forming and broader market conditions remain favorable.
Also Read: Pi Network (PI) Price Prediction 2026–2030: Can PI Hit $0.30 Soon?
The post GRASS (GRASS) Price Prediction 2026–2030: Can GRASS Hit $0.30 Soon? appeared first on 36Crypto.


You May Also Like
Strategy CEO Highlights Scenarios Where Company Would Sell Bitcoin — Report

Scott Jennings accused of 'cheating' as fiery exchange breaks out on CNN: 'Let me finish!'