

BRETT Momentum Check: Will the Price Sink Even Lower?
- BRETT is trading near the $0.0072 mark.
- The daily trading volume has reached $5.14M
The 2.92% loss has rekindled the sentiment shift across the market into extreme fear again. As a result, the majority of the crypto assets have faced notable losses. Meanwhile, the meme coin market cap has slipped by over 2.71% to the $31.10 billion mark. Among them, Brett (Based) (BRETT) has taken a 3.88% drop in value over the last 24 hours.
In the early hours, the meme coin traded at a high of $0.007694. With the bearish encounter, the BRETT price has tumbled to a low of $0.007052. At the time of writing, BRETT traded within the $0.007269 range, with its market cap at $72.53 million. In addition, the daily trading volume has spiked by over 9.20%, reaching the $5.14 million zone.
Assuming BRETT loses more momentum, the price might retrace to a support at around $0.007037. Further losses could initiate the formation of the death cross, and it would send the price down deeper to its former low of $0.006810. If a bullish recovery happens, the BRETT price could take enough effort to reclaim the nearest resistance at the $0.007452 range. With the emergence of a golden cross, the price may climb higher to retest the $0.007681 level.
BRETT at a Turning Point: Recovery Rally or Deeper Pullback?
BRETT’s Moving Average Convergence Divergence line is below the zero line, while the signal line is above, which reflects mixed momentum. With the MACD being below zero, the broader trend carries bearish pressure. This divergence hints at an uncertain market direction.
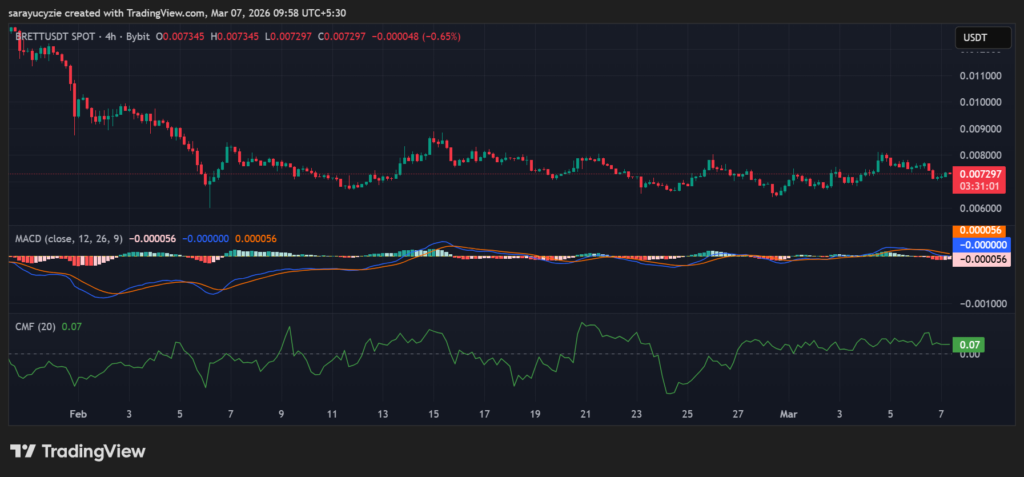 BRETT chart (Source: TradingView)
The Chaikin Money Flow indicator at 0.07 shows mild buying pressure in the BRETT market. The capital inflow is slightly higher than the outflow, giving early signs of accumulation. If CMF continues to rise, the bullish momentum grows, while a drop to zero would weaken demand.
Besides, the Bull Bear Power (BBP) value of -0.000156 indicates neutral momentum with a slight bearish bias. As it is extremely close to zero, the BRETT market is largely balanced, displaying a consolidation phase. A shift above zero points to buyers starting to gain control.
Moreover, the daily Relative Strength Index (RSI) reading of BRETT is found at 48.30 suggests a slightly bearish or neutral momentum. It is below the neutral level, and selling pressure is slightly stronger than buying pressure, but the market is largely balanced, with no strong trend.
Top Updated Crypto News
Curve Finance Accuses PancakeSwap of Copying StableSwap Code


You May Also Like

Ethereum Covered Call ETF Launches: Global X’s Strategic Move for Crypto Income Investors

SoFi is launching a 24/7 banking hub that blends traditional cash with crypto


