Toncoin has experienced a difficult period since its 2024 peak. The asset now trades far below those highs after a prolonged decline across the broader crypto marketToncoin has experienced a difficult period since its 2024 peak. The asset now trades far below those highs after a prolonged decline across the broader crypto market

Here’s the Setup That Could Trigger Toncoin (TON) Next 30x Price Rally

2026/03/12 17:30
4 min read
For feedback or concerns regarding this content, please contact us at crypto.news@mexc.com

Toncoin has experienced a difficult period since its 2024 peak. The asset now trades far below those highs after a prolonged decline across the broader crypto market. Recent price action shows TON down more than 80% from the previous cycle top. That steep correction has placed the token inside a zone that some analysts believe could become a long-term accumulation area.

Crypto analyst Crypto Patel recently shared a detailed chart that outlines a potential recovery path for Toncoin. His analysis suggests the current market structure may resemble earlier phases of large crypto rebounds. Crypto Patel argues that deep corrections inside long macro trends sometimes appear before major price expansions.

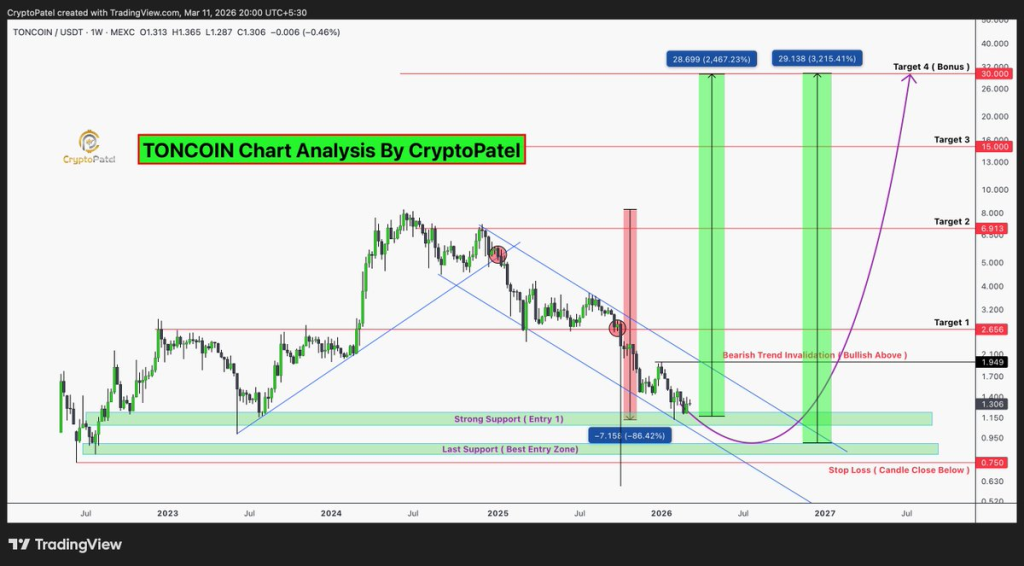
A look at the Toncoin chart shows a long downward move that followed the previous rally. Price gradually lost momentum after reaching the earlier peak. Selling pressure then pushed TON toward a wide demand zone that sits between roughly $0.90 and $1.20.

Crypto Patel explains that this region has acted as strong support during earlier market cycles. The chart shows Toncoin entering that area again after a steep decline that measured more than 80% from the 2024 high.

Price briefly dropped below $1 before moving back above the zone. Crypto Patel describes that move as a liquidity sweep. Market structure often creates those sweeps when price falls below obvious support levels before reversing upward.

The chart marks this region as a potential entry area because buyers historically step in there. Price stabilization around that zone may indicate that selling pressure has weakened.

Source: @CryptoPatel / X

Toncoin Structure Could Change If TON Reclaims The $1.95 Level

Crypto Patel identifies one key level that could determine whether Toncoin begins a recovery phase. The chart shows a descending trendline that has capped price movement throughout the decline. That trendline intersects near the $1.95 region.

Crypto Patel explains that a decisive move above $1.95 would reclaim the broken market structure. Price acceptance above that level could indicate that sellers no longer control the trend.

The chart labels that moment as a bearish trend invalidation point. Crypto Patel believes Toncoin would enter a bullish structure once that barrier breaks and holds.

Market structure changes often start with such breakouts. Previous crypto cycles show that reclaiming a major resistance zone frequently leads to a new expansion phase.

Toncoin Chart Targets Suggest Possible $7, $15, And $30 Price Zones

Crypto Patel outlines a series of potential targets if Toncoin successfully reclaims the key resistance level. The chart displays three major zones that align with earlier price structures.

The first target sits around $7. That level corresponds with a previous consolidation range during the earlier uptrend. A return to that zone would represent the first large recovery phase.

Read Also: Artificial Superintelligence Alliance Surges 77% – Could $FET Be the Next Big Play?

The second target appears near $15. Crypto Patel marks that region as another historical resistance zone where price previously stalled.

The final long term target sits around $30. That level appears near the top of the projected expansion channel drawn on the chart.

Crypto Patel notes that deep retracements often occur during major crypto uptrends. Past cycles across the market show that assets sometimes drop more than 80% before entering their next growth phase.

Toncoin Chart Also Shows a Clear Invalidation Level Near $0.75

Every bullish scenario also includes a level where the analysis becomes invalid. Crypto Patel points to the $0.75 region as the line that would weaken the recovery thesis.

The chart marks this level as a stop loss zone if price closes below it on the weekly timeframe. A breakdown under that area would suggest the demand zone has failed.

Read Also: Could Silver Price Reach $300 in 2026? Analyst Makes Shocking Prediction

Risk levels such as this help traders evaluate both upside potential and downside exposure.

Toncoin now sits at a technical crossroads after months of decline. Crypto Patel believes the current structure resembles earlier accumulation phases seen across crypto cycles.

Subscribe to our YouTube channel for daily crypto updates, market insights, and expert analysis.

The post Here’s the Setup That Could Trigger Toncoin (TON) Next 30x Price Rally appeared first on CaptainAltcoin.

Market Opportunity
TONCOIN Logo
TONCOIN Price(TON)
$1.306
$1.306$1.306
-0.45%
USD
TONCOIN (TON) Live Price Chart
Disclaimer: The articles reposted on this site are sourced from public platforms and are provided for informational purposes only. They do not necessarily reflect the views of MEXC. All rights remain with the original authors. If you believe any content infringes on third-party rights, please contact crypto.news@mexc.com for removal. MEXC makes no guarantees regarding the accuracy, completeness, or timeliness of the content and is not responsible for any actions taken based on the information provided. The content does not constitute financial, legal, or other professional advice, nor should it be considered a recommendation or endorsement by MEXC.

You May Also Like

TradFi Titan BlackRock Debuts Staked Ethereum ETF, Letting Investors Earn Yield Alongside ETH Exposure ⋆ ZyCrypto

TradFi Titan BlackRock Debuts Staked Ethereum ETF, Letting Investors Earn Yield Alongside ETH Exposure ⋆ ZyCrypto

The post TradFi Titan BlackRock Debuts Staked Ethereum ETF, Letting Investors Earn Yield Alongside ETH Exposure ⋆ ZyCrypto appeared on BitcoinEthereumNews.com.
Share
BitcoinEthereumNews2026/03/13 12:15
UK crypto holders brace for FCA’s expanded regulatory reach

UK crypto holders brace for FCA’s expanded regulatory reach

The post UK crypto holders brace for FCA’s expanded regulatory reach appeared on BitcoinEthereumNews.com. British crypto holders may soon face a very different landscape as the Financial Conduct Authority (FCA) moves to expand its regulatory reach in the industry. A new consultation paper outlines how the watchdog intends to apply its rulebook to crypto firms, shaping everything from asset safeguarding to trading platform operation. According to the financial regulator, these proposals would translate into clearer protections for retail investors and stricter oversight of crypto firms. UK FCA plans Until now, UK crypto users mostly encountered the FCA through rules on promotions and anti-money laundering checks. The consultation paper goes much further. It proposes direct oversight of stablecoin issuers, custodians, and crypto-asset trading platforms (CATPs). For investors, that means the wallets, exchanges, and coins they rely on could soon be subject to the same governance and resilience standards as traditional financial institutions. The regulator has also clarified that firms need official authorization before serving customers. This condition should, in theory, reduce the risk of sudden platform failures or unclear accountability. David Geale, the FCA’s executive director of payments and digital finance, said the proposals are designed to strike a balance between innovation and protection. He explained: “We want to develop a sustainable and competitive crypto sector – balancing innovation, market integrity and trust.” Geale noted that while the rules will not eliminate investment risks, they will create consistent standards, helping consumers understand what to expect from registered firms. Why does this matter for crypto holders? The UK regulatory framework shift would provide safer custody of assets, better disclosure of risks, and clearer recourse if something goes wrong. However, the regulator was also frank in its submission, arguing that no rulebook can eliminate the volatility or inherent risks of holding digital assets. Instead, the focus is on ensuring that when consumers choose to invest, they do…
Share
BitcoinEthereumNews2025/09/17 23:52
Edges higher ahead of BoC-Fed policy outcome

Edges higher ahead of BoC-Fed policy outcome

The post Edges higher ahead of BoC-Fed policy outcome appeared on BitcoinEthereumNews.com. USD/CAD gains marginally to near 1.3760 ahead of monetary policy announcements by the Fed and the BoC. Both the Fed and the BoC are expected to lower interest rates. USD/CAD forms a Head and Shoulder chart pattern. The USD/CAD pair ticks up to near 1.3760 during the late European session on Wednesday. The Loonie pair gains marginally ahead of monetary policy outcomes by the Bank of Canada (BoC) and the Federal Reserve (Fed) during New York trading hours. Both the BoC and the Fed are expected to cut interest rates amid mounting labor market conditions in their respective economies. Inflationary pressures in the Canadian economy have cooled down, emerging as another reason behind the BoC’s dovish expectations. However, the Fed is expected to start the monetary-easing campaign despite the United States (US) inflation remaining higher. Investors will closely monitor press conferences from both Fed Chair Jerome Powell and BoC Governor Tiff Macklem to get cues about whether there will be more interest rate cuts in the remainder of the year. According to analysts from Barclays, the Fed’s latest median projections for interest rates are likely to call for three interest rate cuts by 2025. Ahead of the Fed’s monetary policy, the US Dollar Index (DXY), which tracks the Greenback’s value against six major currencies, holds onto Tuesday’s losses near 96.60. USD/CAD forms a Head and Shoulder chart pattern, which indicates a bearish reversal. The neckline of the above-mentioned chart pattern is plotted near 1.3715. The near-term trend of the pair remains bearish as it stays below the 20-day Exponential Moving Average (EMA), which trades around 1.3800. The 14-day Relative Strength Index (RSI) slides to near 40.00. A fresh bearish momentum would emerge if the RSI falls below that level. Going forward, the asset could slide towards the round level of…
Share
BitcoinEthereumNews2025/09/18 01:23