

BTC Spot CVD Chart Analysis: Order Flow and Volume Heatmap Insights as of June 11
BitcoinWorld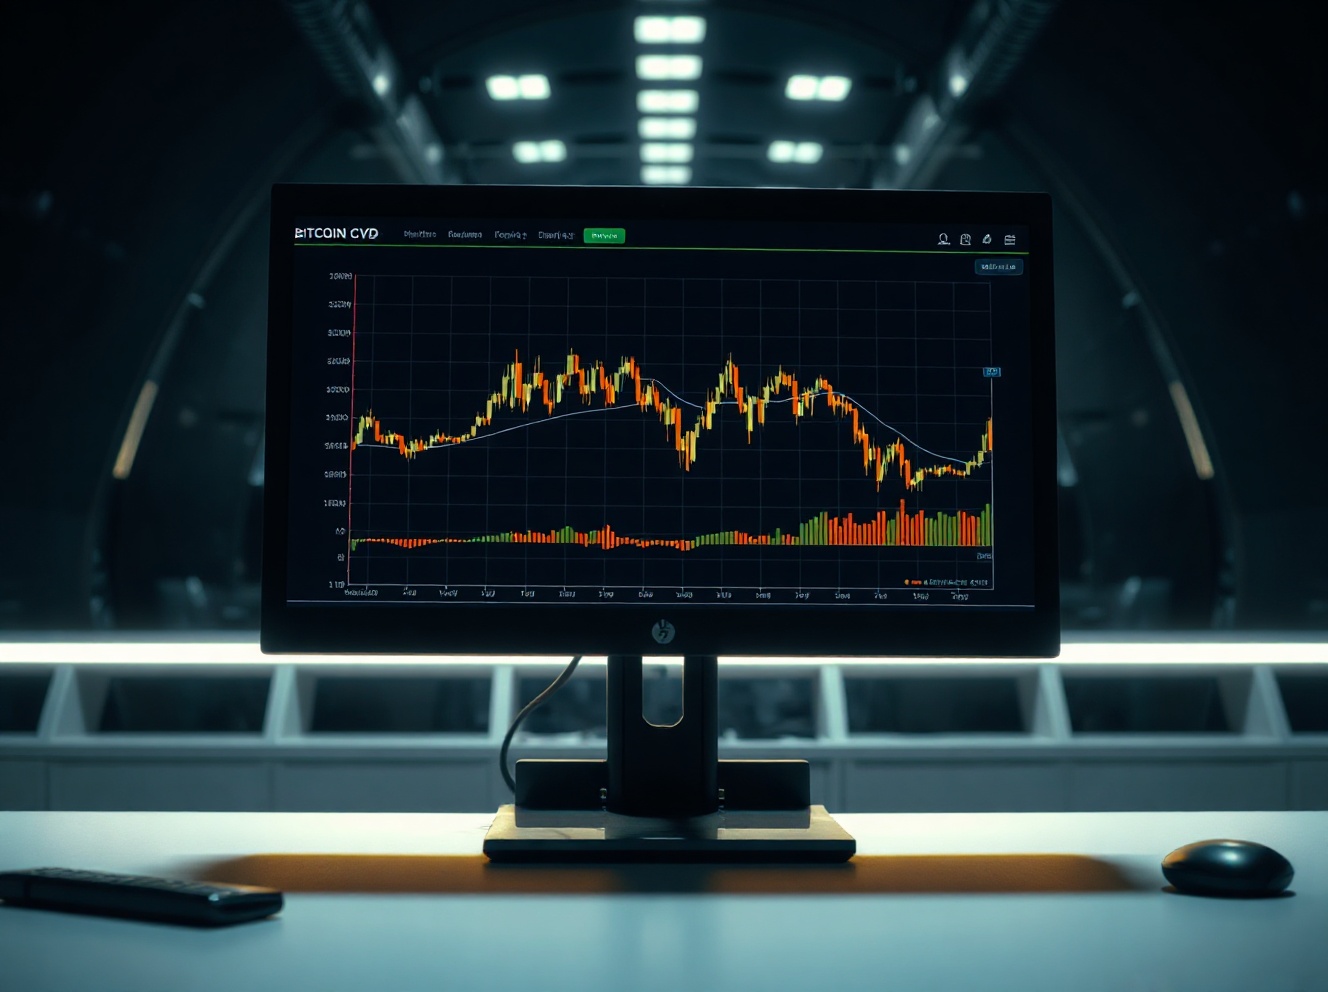
BTC Spot CVD Chart Analysis: Order Flow and Volume Heatmap Insights as of June 11
As of 5:00 a.m. UTC on June 11, the BTC spot Cumulative Volume Delta (CVD) chart for the BTC/USDT pair reveals nuanced order flow dynamics that active traders are closely monitoring. This order book analysis tool, which combines a volume heatmap with a cumulative delta indicator, provides a granular view of buying and selling pressure at specific price levels.
Understanding the Volume Heatmap
The upper section of the chart displays a Volume Heatmap, which tracks trading activity across various price ranges. When the price lingers in a particular zone for an extended period or undergoes a sharp move, the heatmap’s background color intensifies. These brighter areas often serve as visual cues for potential support or resistance levels, helping traders identify where significant interest has accumulated. On the June 11 chart, several such zones are visible, indicating areas where large volumes of BTC have changed hands.
Decoding the Cumulative Volume Delta (CVD)
The lower portion of the chart presents the Cumulative Volume Delta (CVD), which categorizes buy and sell orders by trade size. Each colored line represents a specific order size bracket. For instance, the yellow line tracks orders between $100 and $1,000, while the brown line captures large institutional-sized orders ranging from $1 million to $10 million. As buy orders increase, the corresponding line rises, offering a real-time view of which market participants are driving price action.
What the Data Suggests for Traders
For traders, the CVD chart provides actionable insights beyond simple price movements. By observing which order size brackets are accumulating or distributing, one can gauge whether retail or institutional players are dominating the market. As of the early June 11 snapshot, the data suggests a mixed sentiment, with mid-sized orders showing steady accumulation while larger orders remain cautious. This divergence often precedes periods of consolidation or a breakout, depending on follow-through in the coming sessions.
Why This Matters
Understanding order flow is critical for short-term traders and swing traders alike. The CVD chart offers a layer of transparency that traditional candlestick charts alone cannot provide. By revealing the intensity and size of trades at key price levels, it helps traders avoid false breakouts and identify genuine support or resistance zones. For anyone trading the BTC/USDT pair, this tool is a valuable addition to their technical analysis toolkit.
Conclusion
The BTC spot CVD chart as of June 11 highlights a market in a state of careful positioning. The volume heatmap points to established price zones worth watching, while the cumulative delta lines suggest a tug-of-war between different trader cohorts. As always, traders should combine this data with broader market context and risk management strategies.
FAQs
Q1: What is the BTC spot CVD chart used for?
The BTC spot CVD chart is used to analyze order flow by tracking cumulative buying and selling volume at different price levels and trade sizes. It helps traders identify support and resistance zones and gauge market sentiment.
Q2: How does the volume heatmap differ from the CVD?
The volume heatmap shows the intensity of trading activity at specific price levels over time, while the CVD tracks the net difference between buy and sell orders, broken down by trade size.
Q3: What do the different colored lines in the CVD represent?
Each colored line in the CVD represents a specific order size bracket. For example, yellow tracks orders from $100 to $1,000, while brown tracks orders from $1 million to $10 million, allowing traders to see which participant group is most active.
This post BTC Spot CVD Chart Analysis: Order Flow and Volume Heatmap Insights as of June 11 first appeared on BitcoinWorld.


Ayrıca Şunları da Beğenebilirsiniz

Nigeria invests $9m in research to drive digital economy ambitions

US Dollar Index Rebounds as US-Iran Ceasefire Talks Fuel Uncertainty

Ethereum reserves on exchanges hit an all-time low at 14.5 million! What could this signal for ETH investors?


Popüler Haberler
Daha fazla
