Pi Network price has recovered from its recent record low, but a developing bearish continuation pattern and another wave of token unlocks have kept the risk ofPi Network price has recovered from its recent record low, but a developing bearish continuation pattern and another wave of token unlocks have kept the risk of

Will Pi Network price hit a new all-time low as a risky pattern forms?

2026/06/13 02:31
Okuma süresi: 5 dk
Bu içerikle ilgili geri bildirim veya endişeleriniz için lütfen crypto.news@mexc.com üzerinden bizimle iletişime geçin.

Pi Network price has recovered from its recent record low, but a developing bearish continuation pattern and another wave of token unlocks have kept the risk of a fresh all-time low firmly in focus.

Summary
  • Pi Network faces fresh downside risk as a descending triangle forms near key support at $0.124.
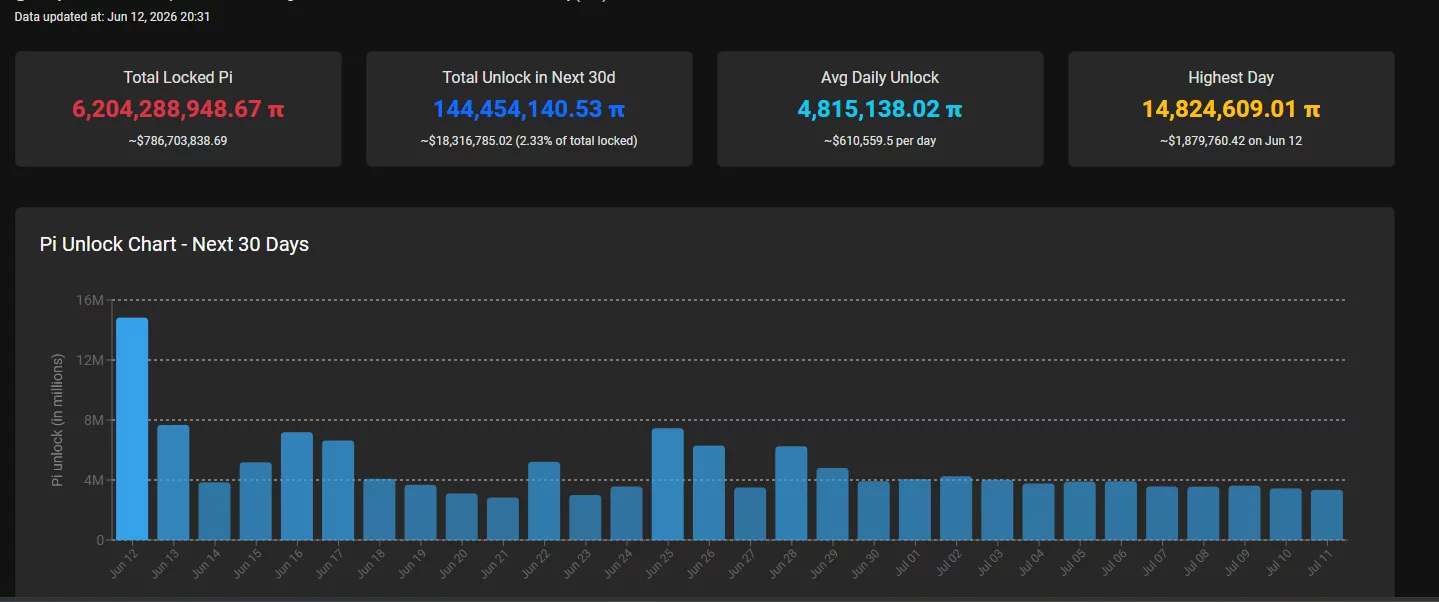
  • More than 144 million PI tokens are scheduled to unlock over the next 30 days, keeping supply pressure elevated.
  • Bulls must reclaim $0.130 and break above $0.145 to reduce the risk of a new all-time low.

According to crypto.news data, Pi Network (PI) traded near $0.128 on June 12 after rebounding from its June 6 low around $0.119. The token gained roughly 1.8% over the past 24 hours as Bitcoin climbed more than 2% and the total cryptocurrency market capitalization rose to $2.18 trillion.

Improved risk appetite followed reports that President Donald Trump halted planned U.S. airstrikes against Iran, while traders also reacted to SpaceX’s public market debut and its reported Bitcoin holdings.

June 18 has emerged as the next major catalyst for the ecosystem. The Pi Core Team has required all Mainnet node operators to complete the Protocol 25 upgrade by that date, warning that nodes that fail to upgrade may be disconnected from the network.

The upgrade introduces compatibility with Stellar Core V20 and lays the groundwork for Soroban smart contracts, a development many holders view as a step toward DeFi and tokenization use cases within the Pi ecosystem.

Exchange flows have started to improve despite the weak price trend. Recent wallet data showed 579,018 PI leaving tracked centralized exchanges against inflows of 319,304 PI, resulting in net outflows of 259,714 tokens.

Exchange balances stood at roughly 546.4 million PI, while most major trading venues, including OKX, Bitget, MEXC, Gate.io, LBank, and Kraken, recorded negative daily flows.

Reduced exchange balances can ease immediate selling pressure, although the effect remains limited by the network’s unlock schedule.

Fresh supply continues to enter circulation at a rapid pace. Pi unlock data shows that approximately 144.45 million PI tokens will be released over the next 30 days, representing about 2.33% of locked supply. Average daily unlocks stand near 4.8 million tokens, while June 12 alone is scheduled to see more than 14.8 million PI unlocked, the largest single-day release during the period.

Pi Network token unlock schedule showing over 144 million PI set for release in the next 30 days.

Thin liquidity has amplified the impact of those releases. Daily trading activity remains relatively modest compared with the size of incoming supply, leaving the token vulnerable to selling from early miners and users completing KYC verification and Mainnet migration.

Previous unlock waves coincided with accelerated declines as newly available tokens entered exchange wallets.

Descending triangle keeps pressure on key support

The four-hour chart shows PI forming an inverse cup-and-handle pattern after its recovery from the June 6 low near $0.119. Price climbed toward $0.132 before losing momentum and carving out a downward-sloping handle beneath resistance. The structure places key support between $0.124 and $0.125.

Pi Network price has formed an inverse cup-and-handle pattern on the 4-hour chart.

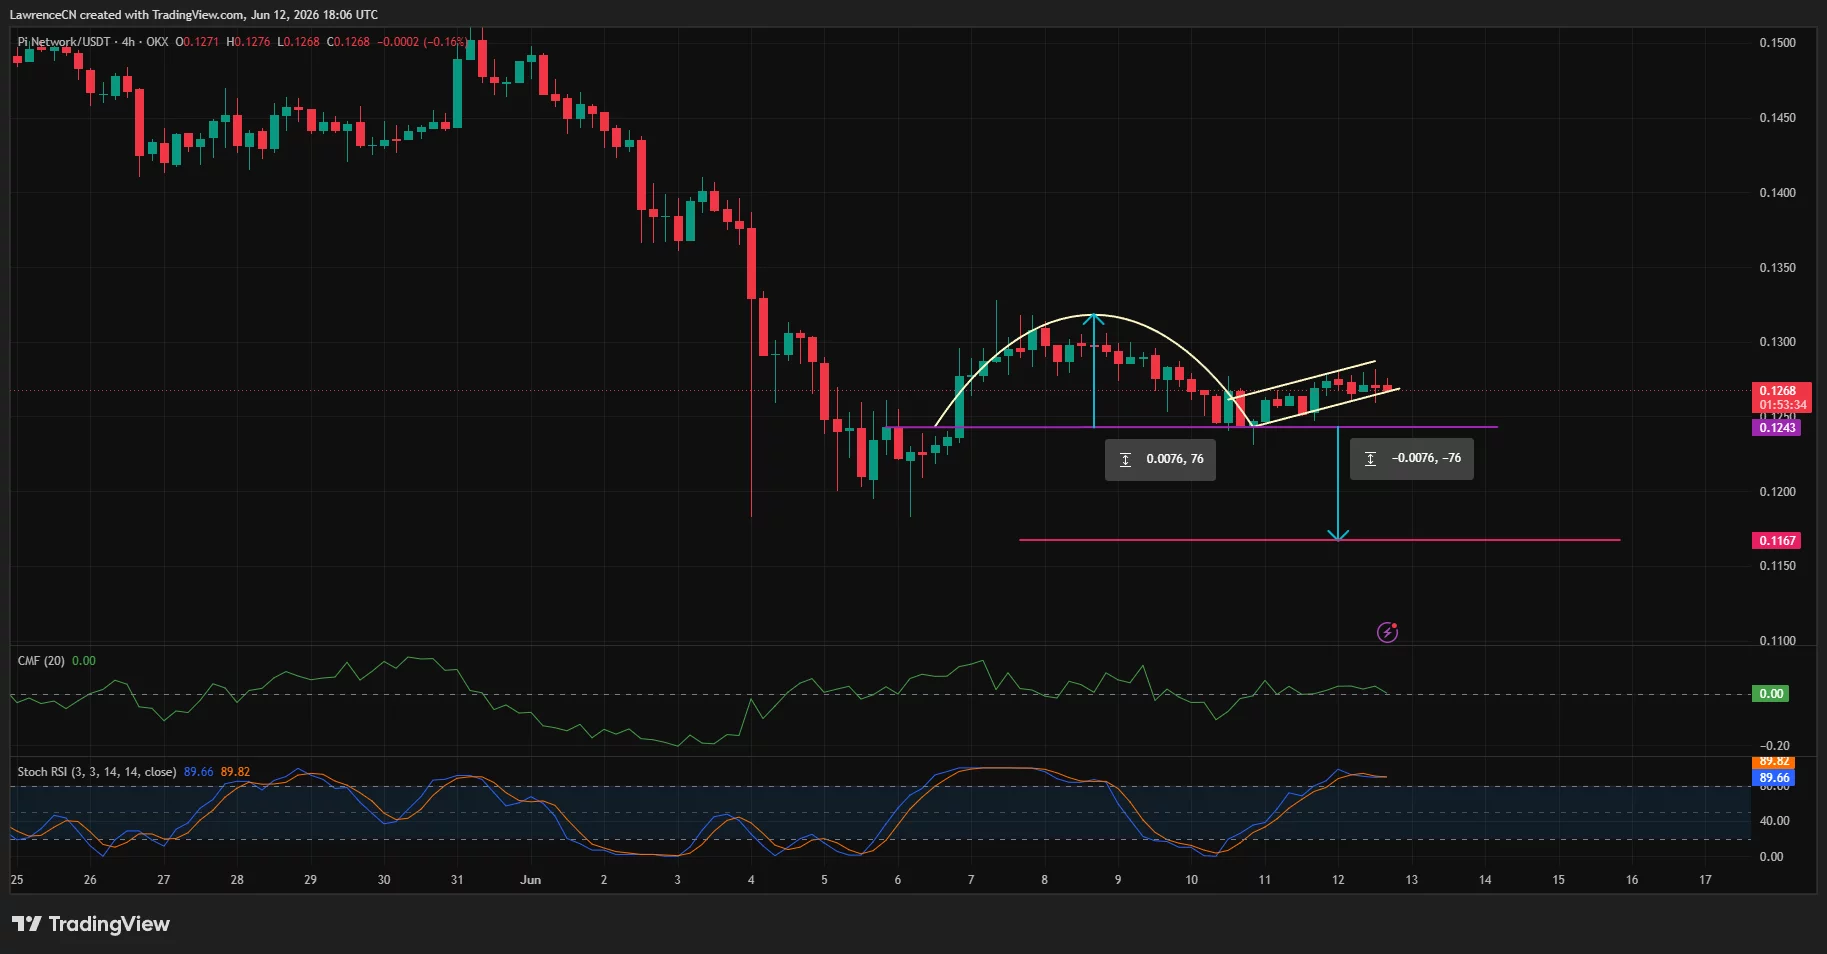
A breakdown below that zone would confirm the bearish continuation pattern and expose the measured target near $0.116. Such a move would place the June all-time low back under pressure and could open the door to another leg lower if sellers regain control.

The daily chart presents a similar picture. PI remains trapped beneath a descending trendline that has controlled price action since early May. The token also continues to trade below its Supertrend resistance near $0.146, while a former support area around $0.130 has turned into overhead resistance.

Pi Network price daily chart.

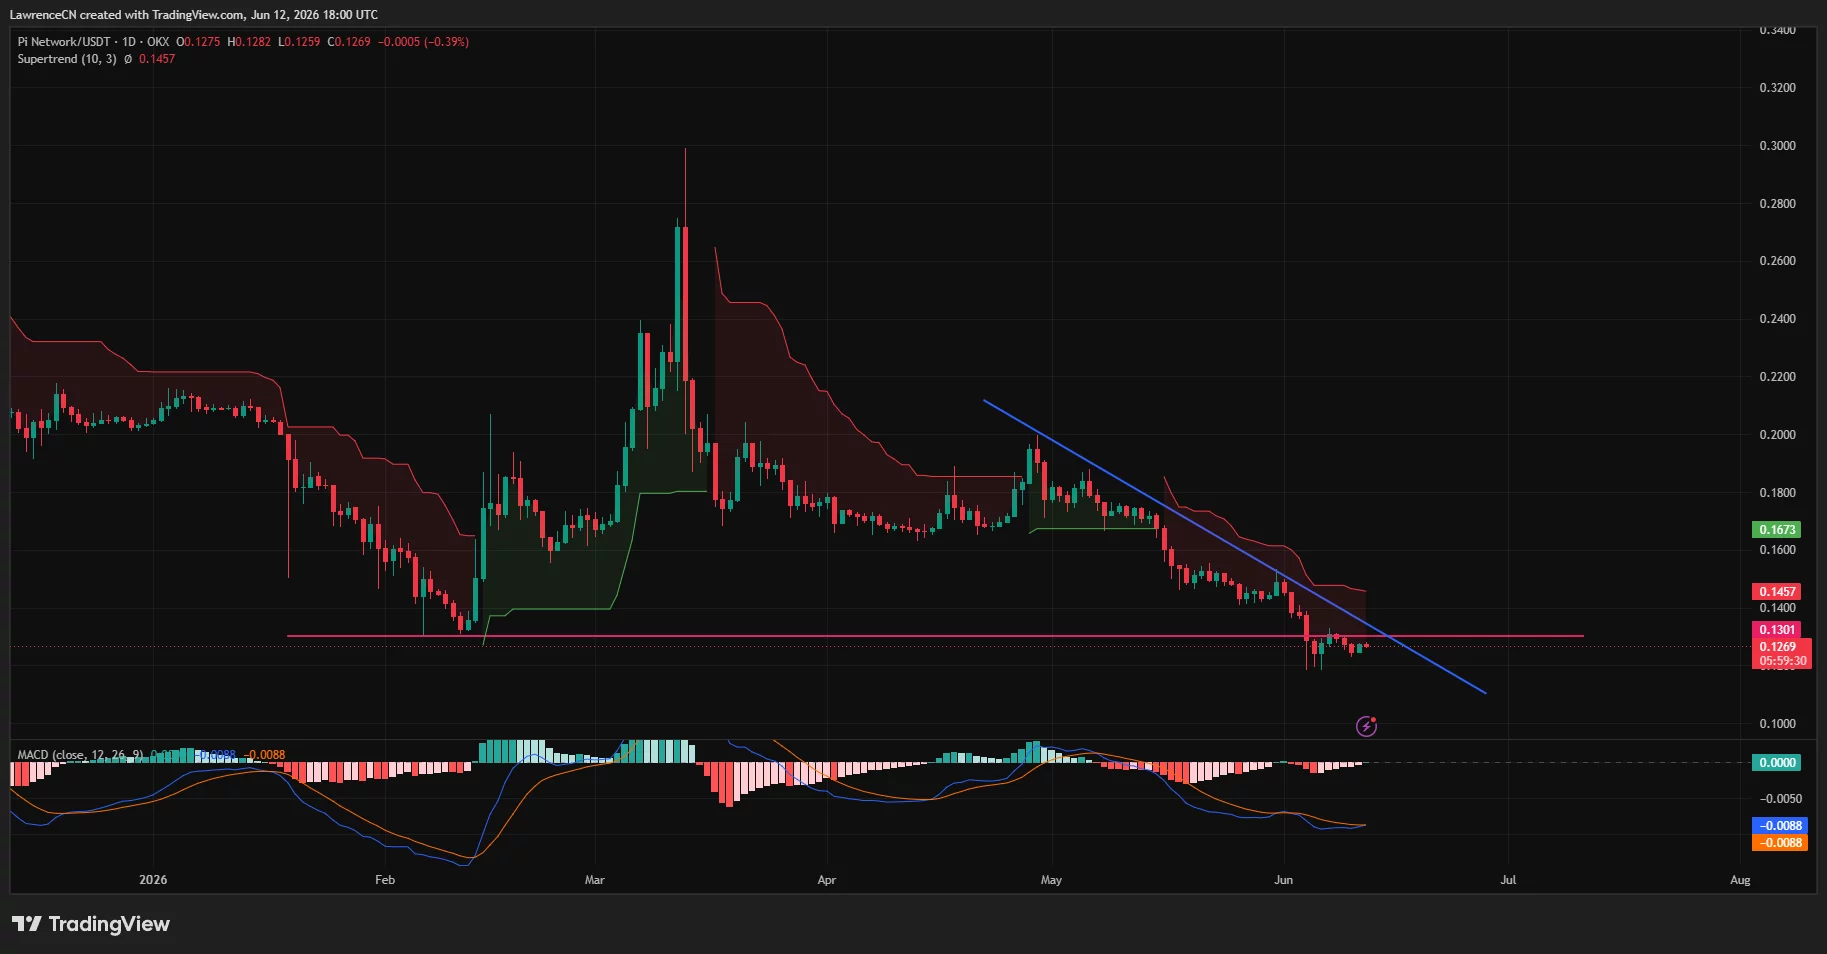
Momentum indicators have yet to deliver a convincing bullish reversal. The MACD remains below the zero line despite some improvement in histogram readings, while price continues to print a sequence of lower highs and lower lows. Stochastic RSI on the four-hour timeframe has climbed into overbought territory, raising the possibility of another short-term pullback.

Token unlocks and macro risks threaten the recovery

Macro conditions remain another source of uncertainty. Pi’s latest rebound arrived alongside a recovery in Bitcoin and risk assets, but any reversal in crypto sentiment could quickly revive selling pressure across smaller-cap tokens.

Large altcoins continue to trade near critical support levels, and leveraged crypto markets remain sensitive to geopolitical headlines and Federal Reserve policy expectations.

For Pi Network, bulls must reclaim $0.130 and then break above the descending trendline near $0.145 to invalidate the current bearish structure. A successful breakout would also put the Supertrend resistance at risk and improve the odds of a move toward $0.18.

Until then, the combination of persistent token unlocks, weak long-term trend structure, and a developing bearish pattern leaves PI vulnerable to another breakdown.

A decisive move below $0.124 would increase the probability of a retest of $0.119 and could open the door to a fresh all-time low below the June bottom.

Disclosure: This article does not represent investment advice. The content and materials featured on this page are for educational purposes only.

Piyasa Fırsatı
Pi Network Logosu
Pi Network Fiyatı(PI)
$0.13478
$0.13478$0.13478
+4.90%
USD
Pi Network (PI) Canlı Fiyat Grafiği

World Cup Combo: Aim for 200x

World Cup Combo: Aim for 200xWorld Cup Combo: Aim for 200x

Combine up to 20 World Cup matches in one order

Sorumluluk Reddi: Bu sitede yeniden yayınlanan makaleler, halka açık platformlardan alınmıştır ve yalnızca bilgilendirme amaçlıdır. MEXC'nin görüşlerini yansıtmayabilir. Tüm hakları telif sahiplerine aittir. Herhangi bir içeriğin üçüncü taraf haklarını ihlal ettiğini düşünüyorsanız, kaldırılması için lütfen crypto.news@mexc.com ile iletişime geçin. MEXC, içeriğin doğruluğu, eksiksizliği veya güncelliği konusunda hiçbir garanti vermez ve sağlanan bilgilere dayalı olarak alınan herhangi bir eylemden sorumlu değildir. İçerik, finansal, yasal veya diğer profesyonel tavsiye niteliğinde değildir ve MEXC tarafından bir tavsiye veya onay olarak değerlendirilmemelidir.

Ayrıca Şunları da Beğenebilirsiniz

Daily XRP transfer volume surpasses 500 million! What does this mean during the latest price drop?

Daily XRP transfer volume surpasses 500 million! What does this mean during the latest price drop?

🚨 Daily transfer volume in $XRP just topped 500 million XRP. 📈 Network usage fully rebounded after a big selloff while price is still weak. 🛡️ Over 145,000 users
Paylaş
COINTURK EN2026/06/19 21:08
Ethereum koers toont zeldzaam dubbel koopsignaal en richt zich op $4.550

Ethereum koers toont zeldzaam dubbel koopsignaal en richt zich op $4.550

Connect met Like-minded Crypto Enthusiasts! Connect op Discord! Check onze Discord   Ethereum laat op de uurgrafiek twee opeenvolgende TD Sequential koopsignalen zien. Deze indicator meet uitputting in een trend en geeft vaak een signaal dat de verkoopdruk kan afnemen. Dit dubbele signaal verschijnt rond het niveau van $4.516, waar de ETH prijs kortstondig steun vindt. Dit type formatie komt zelden voor en wordt daarom extra nauwlettend gevolgd. Wat gaat de Ethereum koers hiermee doen? Ethereum koers test steun rond $4.516 De scherpe daling van de Ethereum koers vanaf de prijszone rond $4.800 bracht de ETH prijs in korte tijd naar ongeveer $4.516. Op dit niveau trad duidelijke koopactiviteit op, waardoor de neerwaartse beweging tijdelijk werd gestopt. Het dubbele signaal dat door de TD Sequential indicator is gegenereerd, viel precies samen met dit prijspunt. De TD Sequential is opgebouwd uit negen candles die een trend meetellen. Wanneer de negende candle verschijnt, kan dit duiden op een trendomslag. In dit geval verschenen zelfs twee signalen kort na elkaar, wat aangeeft dat de verkoopdruk mogelijk uitgeput is. Het feit dat dit gebeurde in een zone waar ETH kopers actief bleven, maakt het patroon extra opvallend. TD Sequential just flashed two buy signals for Ethereum $ETH! pic.twitter.com/JPO8EhiEPi — Ali (@ali_charts) September 16, 2025 Welke crypto nu kopen?Lees onze uitgebreide gids en leer welke crypto nu kopen verstandig kan zijn! Welke crypto nu kopen? Fed-voorzitter Jerome Powell heeft aangekondigd dat de rentes binnenkort zomaar eens omlaag zouden kunnen gaan, en tegelijkertijd blijft BlackRock volop crypto kopen, en dus lijkt de markt klaar om te gaan stijgen. Eén vraag komt telkens terug: welke crypto moet je nu kopen? In dit artikel bespreken we de munten die… Continue reading Ethereum koers toont zeldzaam dubbel koopsignaal en richt zich op $4.550 document.addEventListener('DOMContentLoaded', function() { var screenWidth = window.innerWidth; var excerpts = document.querySelectorAll('.lees-ook-description'); excerpts.forEach(function(description) { var excerpt = description.getAttribute('data-description'); var wordLimit = screenWidth wordLimit) { var trimmedDescription = excerpt.split(' ').slice(0, wordLimit).join(' ') + '...'; description.textContent = trimmedDescription; } }); }); Technische indicatoren schetsen herstelkans voor ETH Naast de dubbele koopsignalen verstrekken ook andere indicatoren belangrijke aanwijzingen. Tijdens de daling van de ETH koers waren grote rode candles zichtbaar, maar na de test van $4.516 stabiliseerde de Ethereum koers. Dit wijst op een mogelijke verschuiving in het evenwicht tussen de bears en bulls. Als deze opwaartse beweging doorzet, liggen de eerste weerstanden rond $4.550. Daarboven wacht een sterkere zone rond $4.650. Deze niveaus zijn in eerdere Ethereum sessies al meerdere keren getest. Een doorbraak zou ruimte openen richting de all-time high van ETH rond $4.953. Wanneer de prijs toch opnieuw onder $4.516 zakt, liggen er zones rond $4.500 en $4.450 waar grotere kooporders worden verwacht. Deze niveaus kunnen als een vangnet fungeren, mocht de druk opnieuw toenemen. Marktdynamiek bevestigt technische indicatoren De huidige situatie volgt op een bredere correctie in de cryptomarkt. Verschillende vooraanstaande crypto tokens zagen scherpe koersdalingen, waarna traders op zoek gingen naar signalen voor een mogelijke ommekeer. Dat juist Ethereum nu een dubbel TD Sequential signaal toont, versterkt de interesse in dit scenario. Fundamenteel blijft Ethereum sterk. Het aantal ETH tokens dat via staking is vastgezet, blijft groeien. Dat verkleint de vrije circulatie en vermindert verkoopdruk. Tegelijk blijft het netwerk intensief gebruikt voor DeFi, NFT’s en stablecoins. Deze activiteiten zorgen voor een stabiele vraag naar ETH, ook wanneer de prijs tijdelijk onder druk staat. Fundamentele drijfveren achter de Ethereum koers De Ethereum koers wordt echter niet alleen bepaald door candles en patronen, maar ook door bredere factoren. Een stijgend percentage van de totale ETH supply staat vast in staking contracten. Hierdoor neemt de liquiditeit op exchanges af. Dit kan prijsschommelingen versterken wanneer er plotseling meer koopdruk ontstaat. Daarnaast is Ethereum nog steeds het grootste smart contract platform. Nieuwe standaarden zoals ERC-8004 en ontwikkelingen rond layer-2 oplossingen houden de activiteit hoog. Deze technologische vooruitgang kan de waardepropositie ondersteunen en zo indirect bijdragen aan een ETH prijsherstel. Het belang van de korte termijn dynamiek De komende handelsdagen zullen duidelijk maken of de bulls genoeg kracht hebben om door de weerstandszone rond $4.550 te breken. Voor de bears ligt de focus juist op het verdedigen van de prijsregio rond $4.516. De whales, die met grote handelsorders opereren, kunnen hierin een beslissende rol spelen. Het dubbele TD Sequential signaal blijft hoe dan ook een zeldzame gebeurtenis. Voor cryptoanalisten vormt het een objectief aanknopingspunt om de kracht van de huidige Ethereum trend te toetsen. Vooruitblik op de ETH koers Ethereum liet twee opeenvolgende TD Sequential signalen zien op de uurgrafiek, iets wat zelden voorkomt. Deze formatie viel samen met steun rond $4.516, waar de bulls actief werden. Als de Ethereum koers boven dit niveau blijft, kan er ruimte ontstaan richting $4.550 en mogelijk $4.650. Zakt de prijs toch opnieuw onder $4.516, dan komen $4.500 en $4.450 in beeld als nieuwe steunzones. De combinatie van zeldzame indicatoren en een sterke fundamentele basis maakt Ethereum interessant voor zowel technische als fundamentele analyses. Of de bulls het momentum echt kunnen overnemen, zal blijken zodra de Ethereum koers de eerstvolgende weerstanden opnieuw test. Koop je crypto via Best Wallet Best wallet is een topklasse crypto wallet waarmee je anoniem crypto kan kopen. Met meer dan 60 chains gesupport kan je al je main crypto coins aanschaffen via Best Wallet. Best wallet - betrouwbare en anonieme wallet Best wallet - betrouwbare en anonieme wallet Meer dan 60 chains beschikbaar voor alle crypto Vroege toegang tot nieuwe projecten Hoge staking belongingen Lage transactiekosten Best wallet review Koop nu via Best Wallet Let op: cryptocurrency is een zeer volatiele en ongereguleerde investering. Doe je eigen onderzoek. Het bericht Ethereum koers toont zeldzaam dubbel koopsignaal en richt zich op $4.550 is geschreven door Dirk van Haaster en verscheen als eerst op Bitcoinmagazine.nl.
Paylaş
Coinstats2025/09/17 23:31
UK Gilt Yields Spike As Burnham Win Opens Door To Oust Starmer

UK Gilt Yields Spike As Burnham Win Opens Door To Oust Starmer

UK Gilt Yields Spike As Burnham Win Opens Door To Oust Starmer The odds of embattled UK Prime Minister Keir Starmer being ousted by the end of July
Paylaş
ZeroHedge2026/06/19 21:05

Score Your Share of 50K USDT

Score Your Share of 50K USDTScore Your Share of 50K USDT

Complete DEX+ tasks to unlock the Champion Wheel