

Ethereum Price Prediction July 2026: Can ETH Hold $1,500 Support?
Ethereum is having a rough summer. ETH trades near $1,577 as of July 1, 2026, down almost 1% on the day and far from its old highs.
The bigger question on traders' minds is simple. Does ETH fall further before it turns around, or has the bottom already formed?
Let's discuss the Ethereum Price Prediction July 2026.
What is Ethereum's price right now?
The altcoin is sitting at $1,577.14, based on the latest market data. That is a small daily drop of $15.29, or 0.96%.
Market cap stands at $190.28 billion. Open interest in futures is $21.81 billion, and 24-hour spot volume is $1.68 billion.
Circulating supply is 120.68 million tokens, matching total supply exactly. There is no max supply cap on Ethereum.
How does the ETH derivatives data look?
Futures volume over 24 hours dropped 9.19% to $34.55 billion. Open interest also fell slightly, down 0.83%.
Options tell a different story. Options open interest actually rose 2.67% to $3.54 billion, even as options volume slipped.
Long and short positioning shows more longs than shorts across major exchanges. Binance's ETH/USDT long-short account ratio sits at 2.38, and OKX shows 2.88.
That means retail traders are leaning bullish, even as price keeps sliding. This kind of gap between sentiment and price action often leads to more liquidations.
Liquidation data backs that up. Over the past 24 hours, $74.40 million in ETH positions got wiped out, with longs taking the bigger hit at $48.21 million.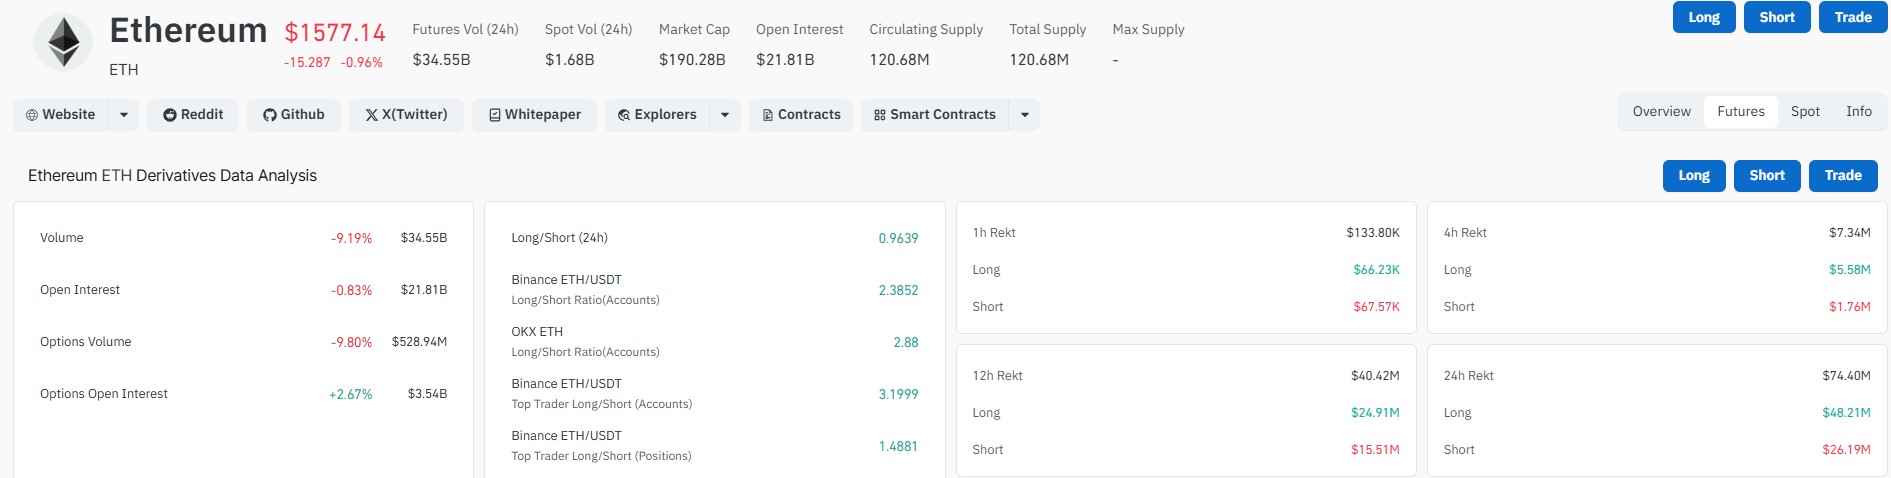
What does the chart show on the daily timeframe?
The daily chart on CoinStats shows the altcoin is trading around $1,577, up slightly from the day's open of $1,572.
Price has been stuck under a falling wedge pattern since February 2026. The 20-day EMA sits at $1,660, the 50-day at $1,814, the 100-day at $1,994, and the 200-day EMA is way up at $2,281.
That stacking of moving averages above current price points suggests a longer downtrend that has not broken yet.
RSI on the daily chart reads 35.09, which is close to oversold territory but not quite there. A drop below 30 would usually signal exhaustion in the sellers.
There is a horizontal support zone forming near $1,500 to $1,550, visible on the chart since early June.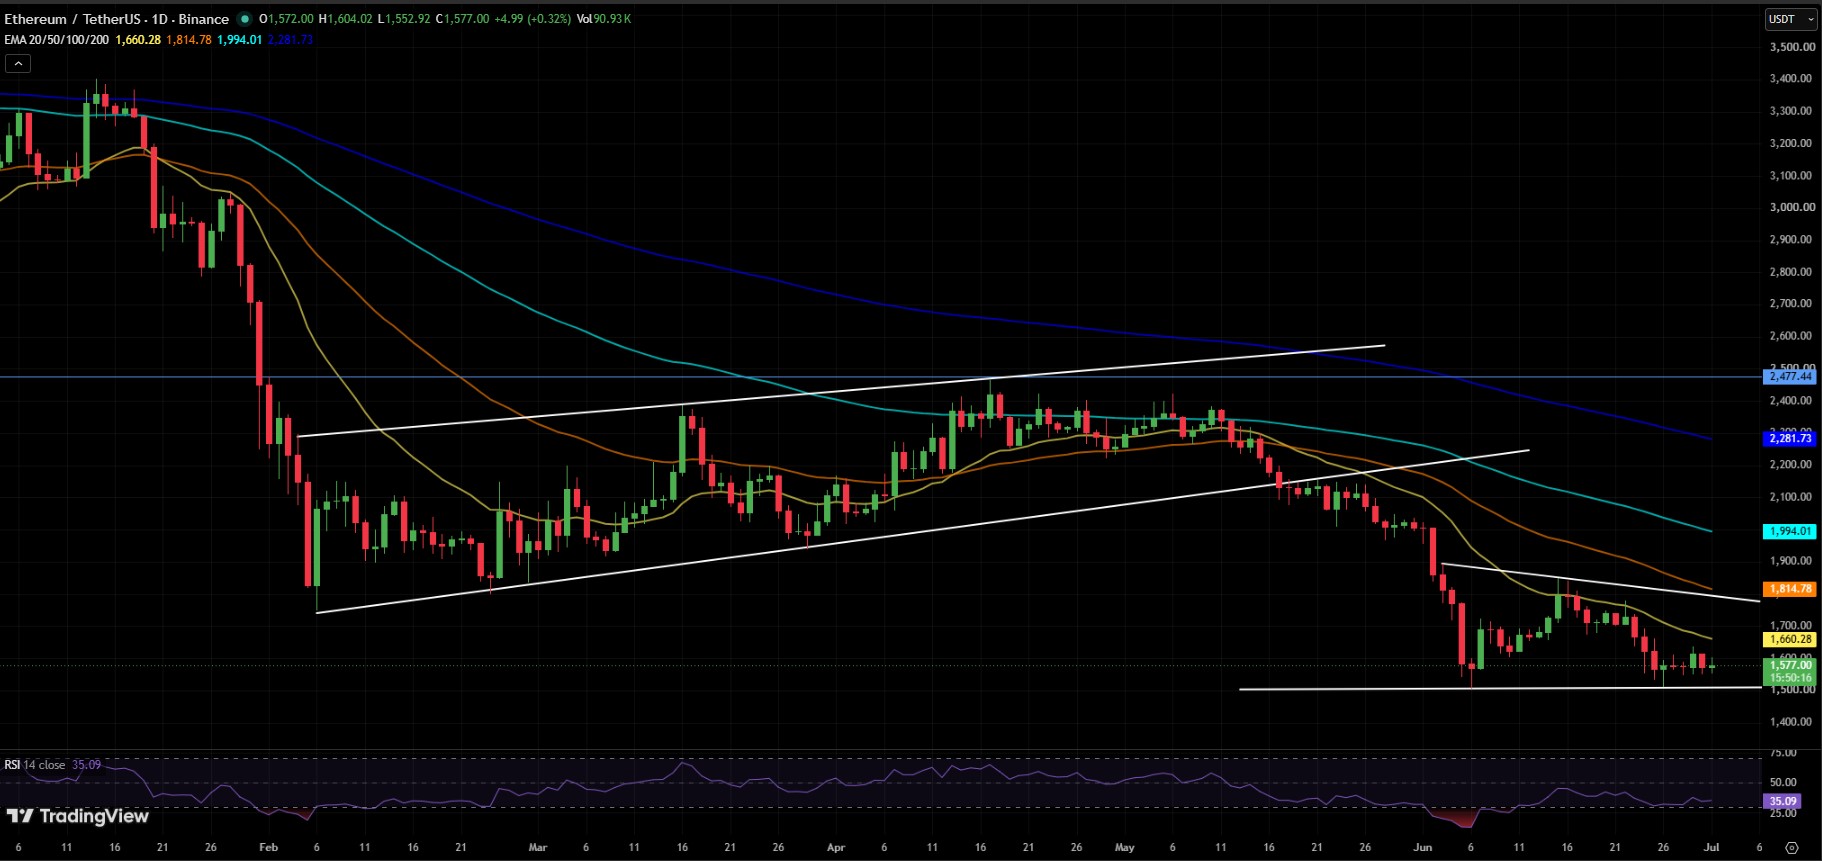
What are analysts predicting for ETH's next move?
Two crypto commentators, going by the names Crypto Patel and Qmo, have shared similar downside targets on social media.
Crypto Patel pointed to the 0.786 Fibonacci retracement level near $1,275 and a psychological support zone around $1,000. The idea is that ETH could dip into that range before any move toward new highs.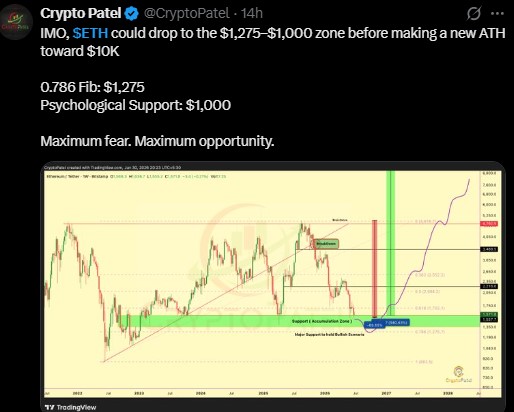
Qmo's post cited an unnamed source called "Legend JAPAN," suggesting ETH drops to $1,260 first, then targets $10,000 by 2028. The chart shared shows a bottom zone between $1,050 and $1,200.
These are informal social media opinions, not verified research, and should be treated with caution.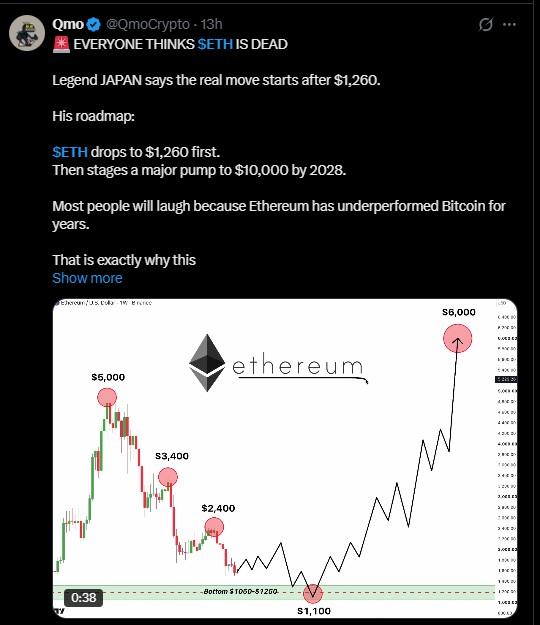
Ethereum Price Data Table
|
Metric |
Value |
|
Current Price (July 1, 2026) |
$1,577.14 |
|
24h Change |
-0.96% (-$15.29) |
|
Market Cap |
$190.28B |
|
Futures Volume (24h) |
$34.55B (-9.19%) |
|
Spot Volume (24h) |
$1.68B |
|
Open Interest |
$21.81B (-0.83%) |
|
Options Open Interest |
$3.54B (+2.67%) |
|
Circulating Supply |
120.68M |
|
Total Supply |
120.68M |
|
24h Total Liquidations |
$74.40M |
|
20-day EMA |
$1,660.28 |
|
50-day EMA |
$1,814.78 |
|
100-day EMA |
$1,994.01 |
|
200-day EMA |
$2,281.73 |
|
Daily RSI (14) |
35.09 |
|
Analyst Downside Target |
$1,275 - $1,000 |
|
Analyst Long-Term Target |
$10,000 by 2028 |
What could push ETH lower or higher from here?
On the downside, the altcoin remains below all four major EMAs, which is a classic sign of a weak trend.
A break under $1,500 could open the door toward the $1,275 zone that chart watchers have flagged.
On the upside, a daily close back above the $1,660 EMA would be an early sign that sellers are losing control.
Staking activity remains a factor unique to Ethereum. Roughly a third of ETH supply sits staked in the network, which reduces the amount actively traded and could matter if demand picks back up.
None of this guarantees a specific outcome. Crypto markets are volatile and can move against even the most widely shared forecasts.
Disclaimer
This article is for informational purposes only and does not constitute financial, investment, or trading advice. Cryptocurrency prices are highly volatile and unpredictable. Always do your own research and consult a licensed financial advisor before making any investment decisions.


Ayrıca Şunları da Beğenebilirsiniz

Crypto Futures Liquidations Top $107M in 24 Hours as Short Sellers Take the Brunt

Argentina vs Egypt Prediction: World Cup 2026 Time, Lineups, Odds and MEXC Prediction Market Guide

EasyJet accepts fifth takeover bid from US firm Castlelake in £5.2b deal


Popüler Haberler
Daha fazla
