Bitcoin price remained under intense pressure this weekend, and may be at risk of a deeper dive, potentially to $75,000 ahead of the Bank of Japan interest rateBitcoin price remained under intense pressure this weekend, and may be at risk of a deeper dive, potentially to $75,000 ahead of the Bank of Japan interest rate

Bitcoin price at risk of a crash to $75 as a major BoJ risk looms

Bitcoin price remained under intense pressure this weekend, and may be at risk of a deeper dive, potentially to $75,000 ahead of the Bank of Japan interest rate decision. 

Summary
  • Bitcoin price could be on the verge of a strong bearish breakout.
  • Odds of BoJ rate hike have jumped to 98% this week.
  • Technical analysis suggests that the coin will drop further soon.

Bitcoin (BTC), the original cryptocurrency, was stuck at the psychological point at $90,000. This price is about 29% below its highest point this year, a sign that it remains in a deep bear market. 

The coin may crash this week as investors anticipate the upcoming Bank of Japan rate hike on December 19. Data on Polymarket show that there is a 98% probability that the bank will hike rates by 5 basis points as it combats the elevated inflation. 

The upcoming BoJ rate hike is notable for a few reasons. First, it will reinforce its independence as Sanae Takaichi, the current prime minister, favors low interest rates. 

Second, the rate hike comes a week after the Fed slashed by 25 basis points, bringing the benchmark policy to between 3.50% and 3.75%. The divergence between the Fed and BoJ often leads to the unwinding of the carry trade that has existed for decades. 

Third, history shows that Bitcoin price drops by double digits when the BoJ hikes rates. The most severe drop happened last year when the bank hiked rates for the first time in decades. 

Meanwhile, the Federal Reserve guided to just one rate cut in 2026, much lower than what analysts were expecting. While Trump may appoint a puppet as Fed Chair, there is a likelihood that other officials will act as a moderating force. Three Fed officials dissented in the last meeting, a trend that may continue next year. 

Bitcoin price technical analysis 

Bitcoin price

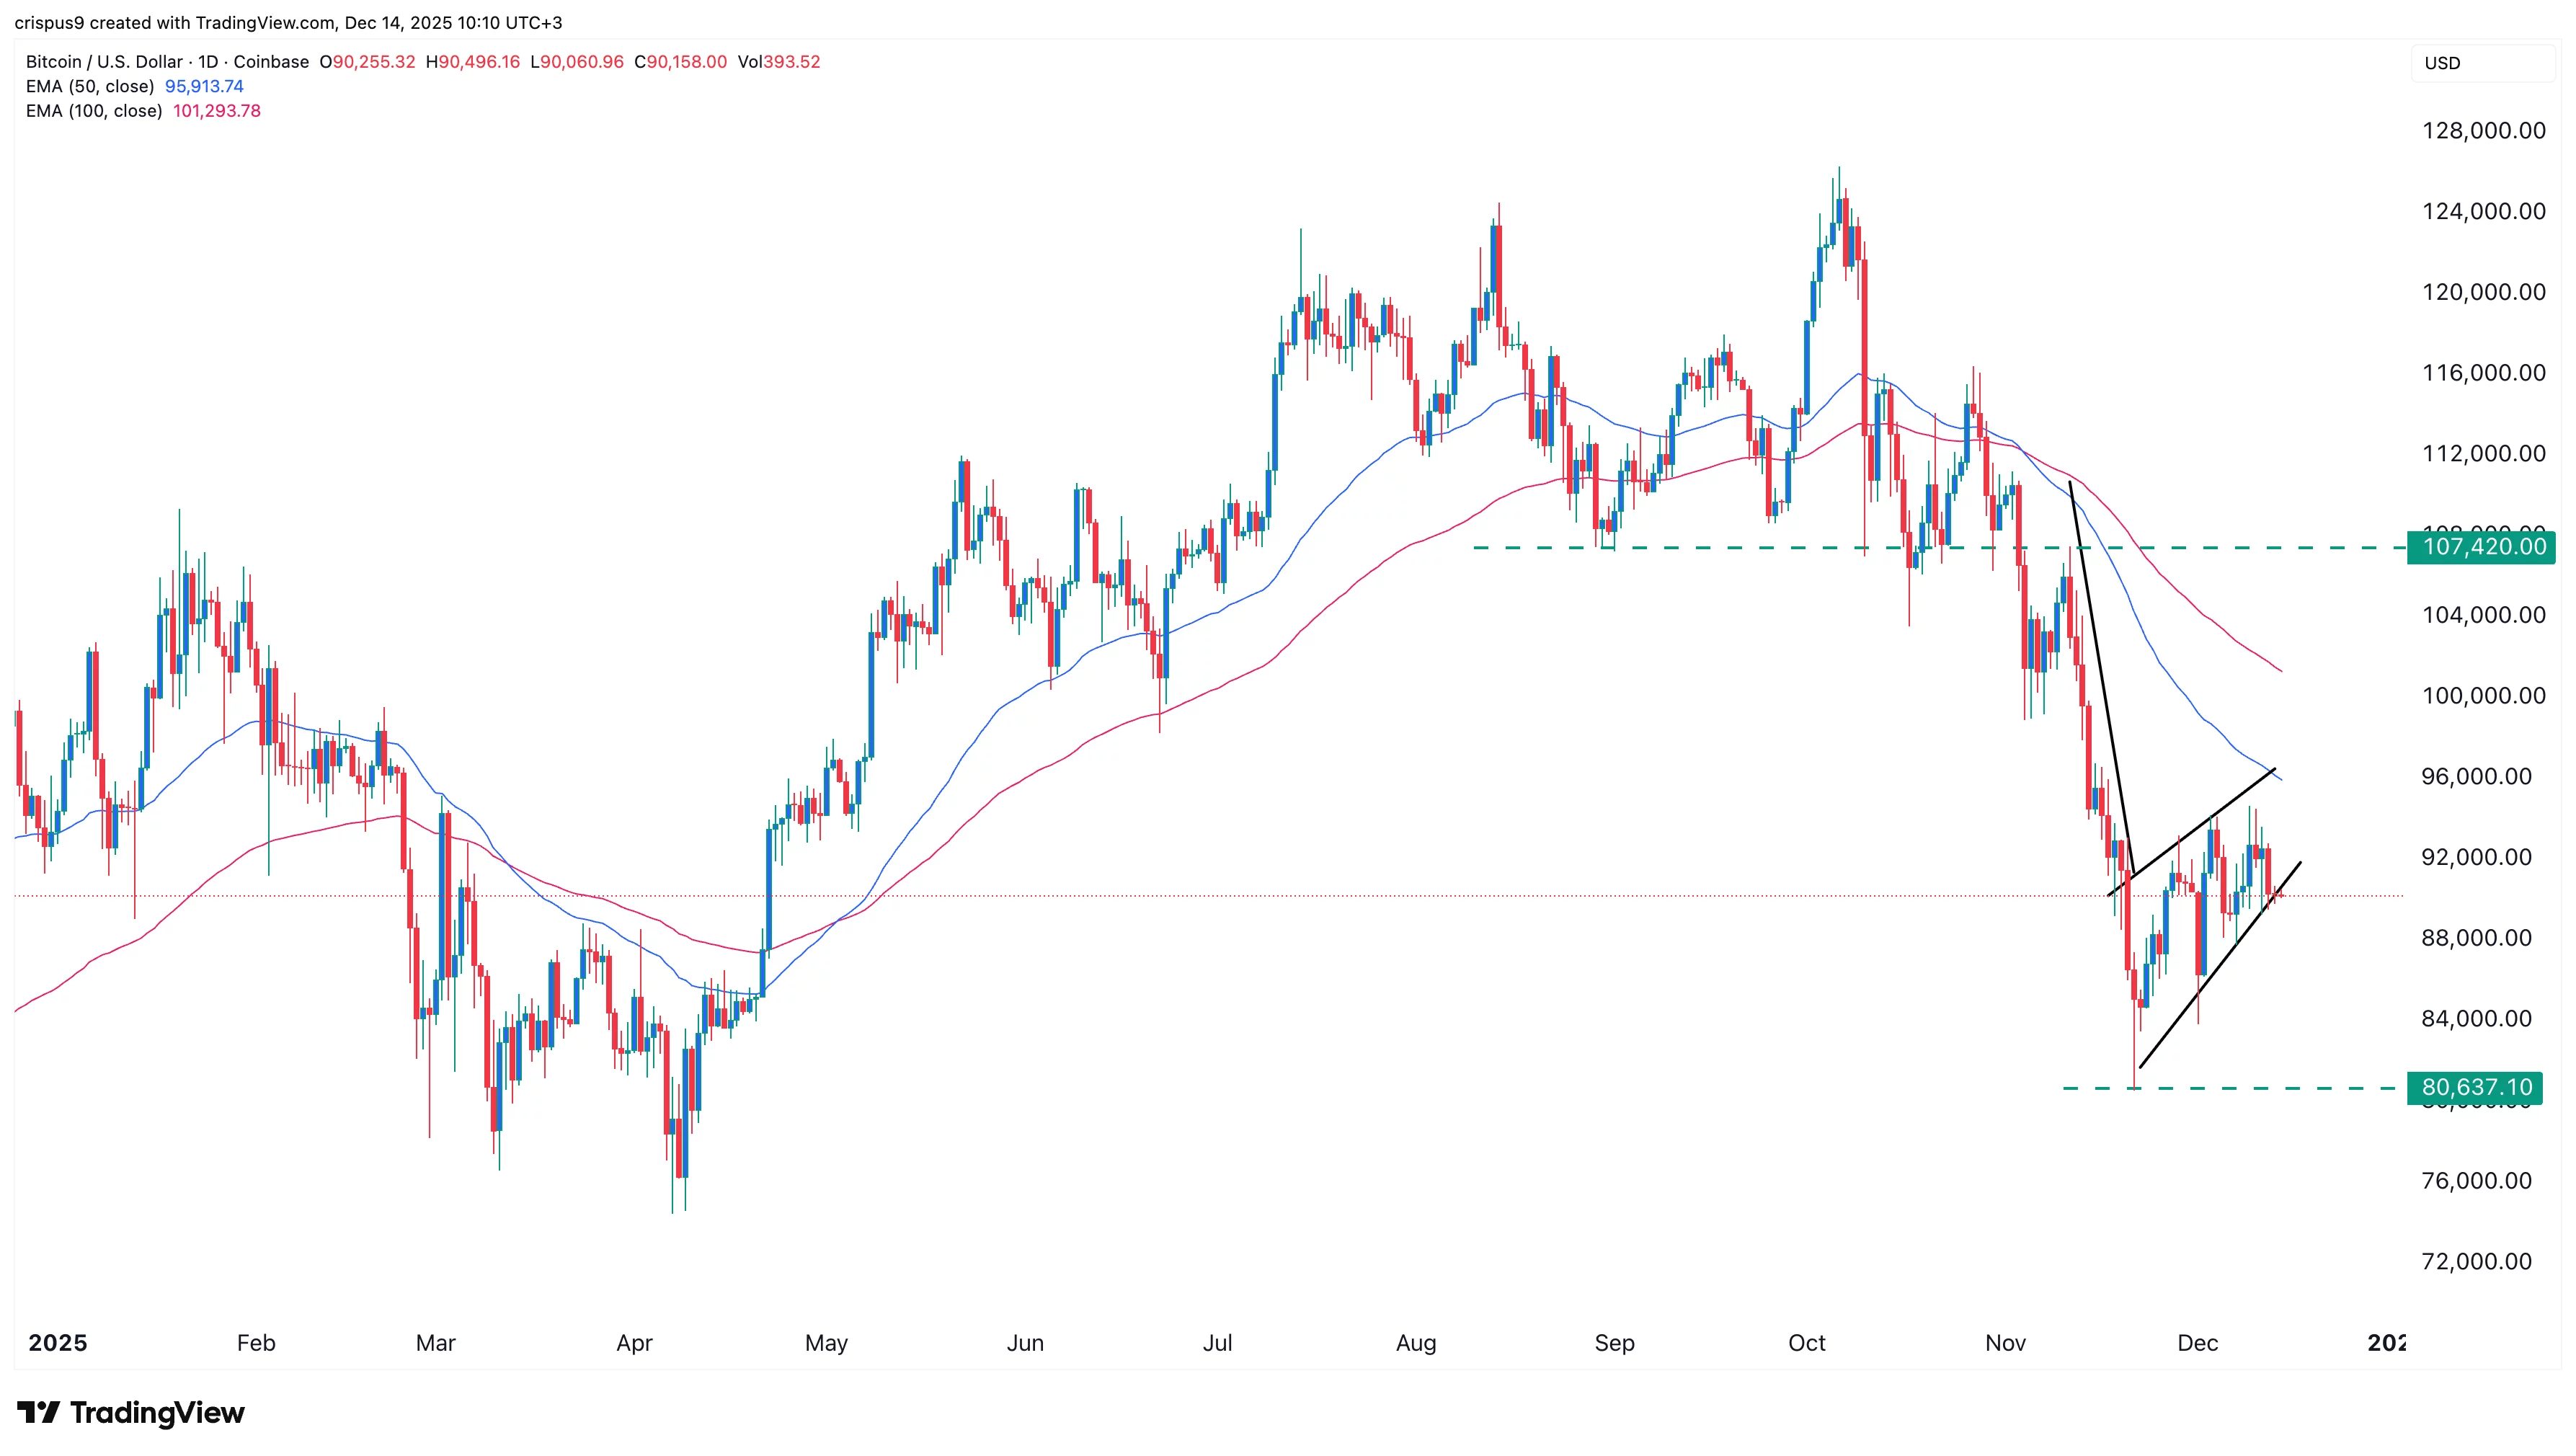
Technical analysis suggests that the Bitcoin price has more downside to go in the coming weeks. It has already formed a death cross pattern on the daily chart.

Bitcoin is now in the process of forming a bearish flag pattern, which is made up of a vertical line and an ascending channel. Like the death cross, this pattern often leads to more downside.

BTC price remains below the Ichimoku cloud and the Supertrend indicators, a sign that bears are in control. Therefore, the most likely outlook is where it continues falling, with the initial target being the November low of $80,000. 

A plunge below that level will point to further downside, potentially to the support at $74,500, the lowest level in April this year.

Piyasa Fırsatı
Major Logosu
Major Fiyatı(MAJOR)
$0.11475
$0.11475$0.11475
-0.77%
USD
Major (MAJOR) Canlı Fiyat Grafiği
Sorumluluk Reddi: Bu sitede yeniden yayınlanan makaleler, halka açık platformlardan alınmıştır ve yalnızca bilgilendirme amaçlıdır. MEXC'nin görüşlerini yansıtmayabilir. Tüm hakları telif sahiplerine aittir. Herhangi bir içeriğin üçüncü taraf haklarını ihlal ettiğini düşünüyorsanız, kaldırılması için lütfen service@support.mexc.com ile iletişime geçin. MEXC, içeriğin doğruluğu, eksiksizliği veya güncelliği konusunda hiçbir garanti vermez ve sağlanan bilgilere dayalı olarak alınan herhangi bir eylemden sorumlu değildir. İçerik, finansal, yasal veya diğer profesyonel tavsiye niteliğinde değildir ve MEXC tarafından bir tavsiye veya onay olarak değerlendirilmemelidir.

Ayrıca Şunları da Beğenebilirsiniz

Trump Cancels Tech, AI Trade Negotiations With The UK

Trump Cancels Tech, AI Trade Negotiations With The UK

The US pauses a $41B UK tech and AI deal as trade talks stall, with disputes over food standards, market access, and rules abroad.   The US has frozen a major tech
Paylaş
LiveBitcoinNews2025/12/17 01:00
Egrag Crypto: XRP Could be Around $6 or $7 by Mid-November Based on this Analysis

Egrag Crypto: XRP Could be Around $6 or $7 by Mid-November Based on this Analysis

Egrag Crypto forecasts XRP reaching $6 to $7 by November. Fractal pattern analysis suggests a significant XRP price surge soon. XRP poised for potential growth based on historical price patterns. The cryptocurrency community is abuzz after renowned analyst Egrag Crypto shared an analysis suggesting that XRP could reach $6 to $7 by mid-November. This prediction is based on the study of a fractal pattern observed in XRP’s past price movements, which the analyst believes is likely to repeat itself in the coming months. According to Egrag Crypto, the analysis hinges on fractal patterns, which are used in technical analysis to identify recurring market behavior. Using the past price charts of XRP, the expert has found a certain fractal that looks similar to the existing market structure. The trend indicates that XRP will soon experience a great increase in price, and the asset will probably reach the $6 or $7 range in mid-November. The chart shared by Egrag Crypto points to a rising trend line with several Fibonacci levels pointing to key support and resistance zones. This technical structure, along with the fractal pattern, is the foundation of the price forecast. As XRP continues to follow the predicted trajectory, the analyst sees a strong possibility of it reaching new highs, especially if the fractal behaves as expected. Also Read: Why XRP Price Remains Stagnant Despite Fed Rate Cut #XRP – A Potential Similar Set-Up! I've been analyzing the yellow fractal from a previous setup and trying to fit it into various formations. Based on the fractal formation analysis, it suggests that by mid-November, #XRP could be around $6 to $7! Fractals can indeed be… pic.twitter.com/HmIlK77Lrr — EGRAG CRYPTO (@egragcrypto) September 18, 2025 Fractal Analysis: The Key to XRP’s Potential Surge Fractals are a popular tool for market analysis, as they can reveal trends and potential price movements by identifying patterns in historical data. Egrag Crypto’s focus on a yellow fractal pattern in XRP’s price charts is central to the current forecast. Having contrasted the market scenario at the current period and how it was at an earlier time, the analyst has indicated that XRP might revert to the same price scenario that occurred at a later cycle in the past. Egrag Crypto’s forecast of $6 to $7 is based not just on the fractal pattern but also on broader market trends and technical indicators. The Fibonacci retracements and extensions will also give more insight into the price levels that are likely to be experienced in the coming few weeks. With mid-November in sight, XRP investors and traders will be keeping a close eye on the market to see if Egrag Crypto’s analysis is true. If the price targets are reached, XRP could experience one of its most significant rallies in recent history. Also Read: Top Investor Issues Advance Warning to XRP Holders – Beware of this Risk The post Egrag Crypto: XRP Could be Around $6 or $7 by Mid-November Based on this Analysis appeared first on 36Crypto.
Paylaş
Coinstats2025/09/18 18:36
Truoux: In the Institutionalized Crypto Markets, How Investors Can Strengthen Anti-Scam Awareness

Truoux: In the Institutionalized Crypto Markets, How Investors Can Strengthen Anti-Scam Awareness

As the crypto market draws increasing attention from institutions, investors must remain vigilant, guard against various scam tactics, and rationally choose compliant
Paylaş
Techbullion2025/12/17 01:31